 GeoData.NZ
Antarctica New Zealand
Type of resources
Available actions
Topics
Keywords
Contact for the resource
Provided by
Years
Update frequencies
status
Scale
-
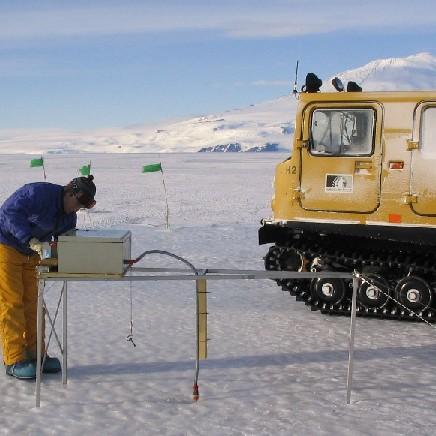
Data provided here have been collected as part of the project "Measurements and Improved Parameterization of the Thermal Conductivity and Heat Flow through First-Year Sea Ice", OPP-0126007* and include measurements of temperature and various ice properties at selected sites in first-year and multiyear sea ice in McMurdo Sound, Antarctica in the years 2002-2004. Data from earlier installations of thermistor chains for measurements of ice temperature carried out by the New Zealand team have also been included. Data files are in Microsoft Excel format, with individual worksheets for specific cores or temperature data sets. Detailed information and comments on data sampling location etc. are provided in the files. Further information on data collection, results etc. can be found in the following publications: Backstrom, L. G. E., and H. Eicken 2007, submitted, Capacitance probe measurements of brine volume and bulk salinity in first-year sea ice, Cold Reg. Sci. Tech. Pringle, D. J., H. Eicken, H. J. Trodahl, and L. G. E. Backstrom 2007, submitted, Thermal conductivity of landfast Antarctic and Arctic sea ice, J. Geophys. Res. Trodahl, H. J., S. O. F. Wilkinson, M. J. McGuinness, and T. G. Haskell 2001, Thermal conductivity of sea ice; dependence on temperature and depth, Geophys. Res. Lett., 28, 1279-1282. Data are in Microsoft Excel format. Abbreviations: AH = Arrival Heights; CH = Camp Haskell (near Delbridge Islands); VUW = Victoria University Wellington; UAF = University Alaska Fairbanks. RELATED PUBLICATION: https://doi.org/10.1017/jog.2022.108 GET DATA: https://drive.google.com/drive/folders/1ooUH9dPvWT66afFC51Cb0JOHg66rn0sy
-
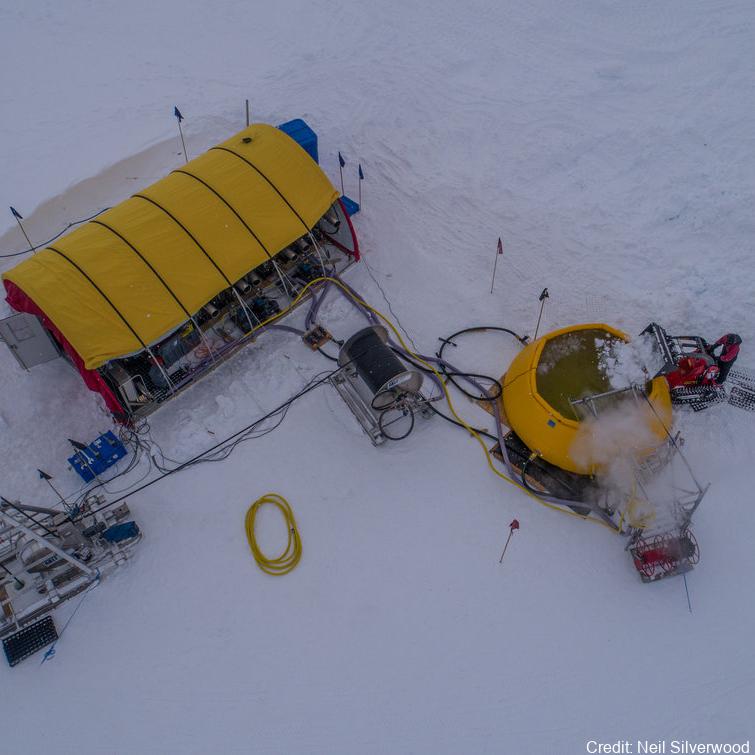
In Antarctica, ice shelves such as the Ross Ice Shelf (RIS) fringe 75% of the coastline and cover over 1.5 million km2, creating distinct and largely unexplored marine environments. It is fundamental to characterize the communities under these shelves to understand their biogeochemical role and predict how they might respond to future ice-shelf collapse 1,2. While historical studies suggested the RIS harbors active microorganisms 3–5, nothing is known about the composition of these communities. In this study, we profiled the composition, function, and activities of microbial communities in three seawater samples (400, 550, 700 m depth) underlying the shelf interior. We combined rate measurements with multi-omics (i.e. single-cell genomics, metagenomics, metatranscriptomics, and metaproteomics). Overall, below-shelf waters harbour microbial communities of comparable abundance and diversity to deep pelagic waters. Based on the meta-omic data, the community is inferred to be sustained by dark carbon fixation using ammonia, nitrite, and sulfur compounds as electron donors. In turn, these chemolithoautotrophs are predicted to support the aerobic heterotrophic majority and various trophic interactions. Consistently, this study and previous activity measurements suggest that dark carbon fixation is sufficient to sustain prokaryotic heterotrophic production, making the waters below the RIS presumably the largest chemolithotrophic system in the global ocean. Further details are provided at https://doi.org/10.1038/s41467-021-27769-5 GET DATA: https://www.ebi.ac.uk/ena/browser/view/PRJEB35712 GET DATA: https://www.ncbi.nlm.nih.gov/bioproject/?term=PRJNA593264
-
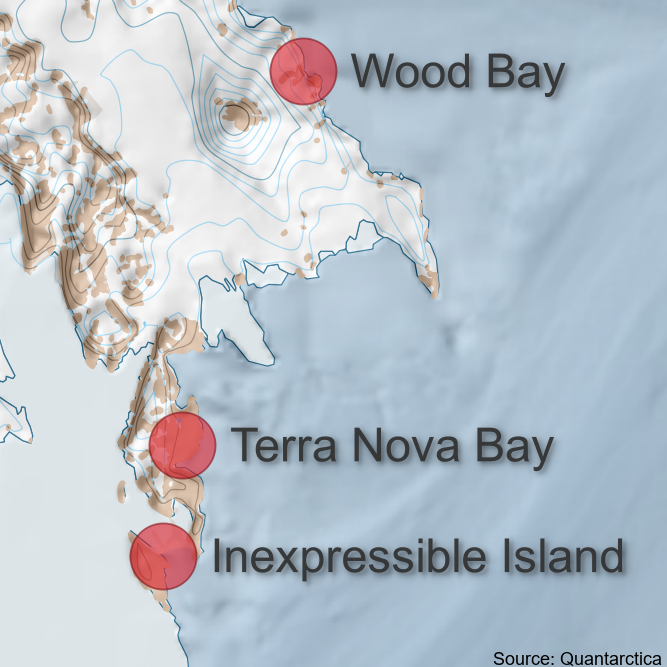
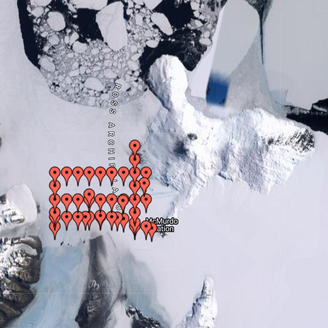
The Antarctica New Zealand Adelie Penguin Census Survey takes aerial images with a helicopter of known penguin colonies on Ross Island and across the Victoria Land coastline. These files provide 36 adelie colony locations. The KML and GeoPackage files both include the same 36 colony locations. Note: colony coordinates are missing for Chinstrap Island, Franklin Island East, and Thala Island. Geopackage and KML files were created in QGIS, and the coordinates were later used to create the GeoPDF files which were used for helicopter navigation to the Adelie penguin colonies.
-
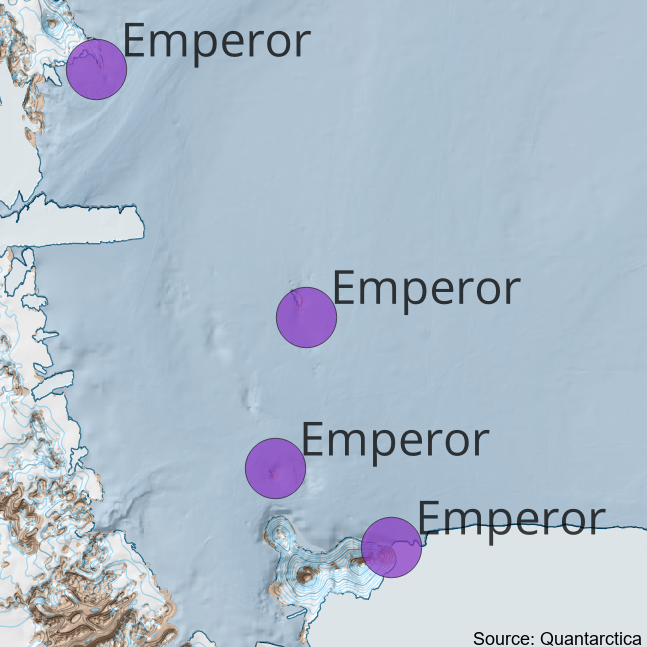
The Antarctica New Zealand Adelie Penguin Census Survey opportunistically took aerial images with a helicopter of known Emperor colonies on Ross Island and across the Victoria Land coastline. These files provide the locations of the colonies surveyed in the 2023/24 season. Geopackage and KML files were created in QGIS, and the coordinates were later used to create the GeoPDF files which were used for helicopter navigation to the colonies.
-
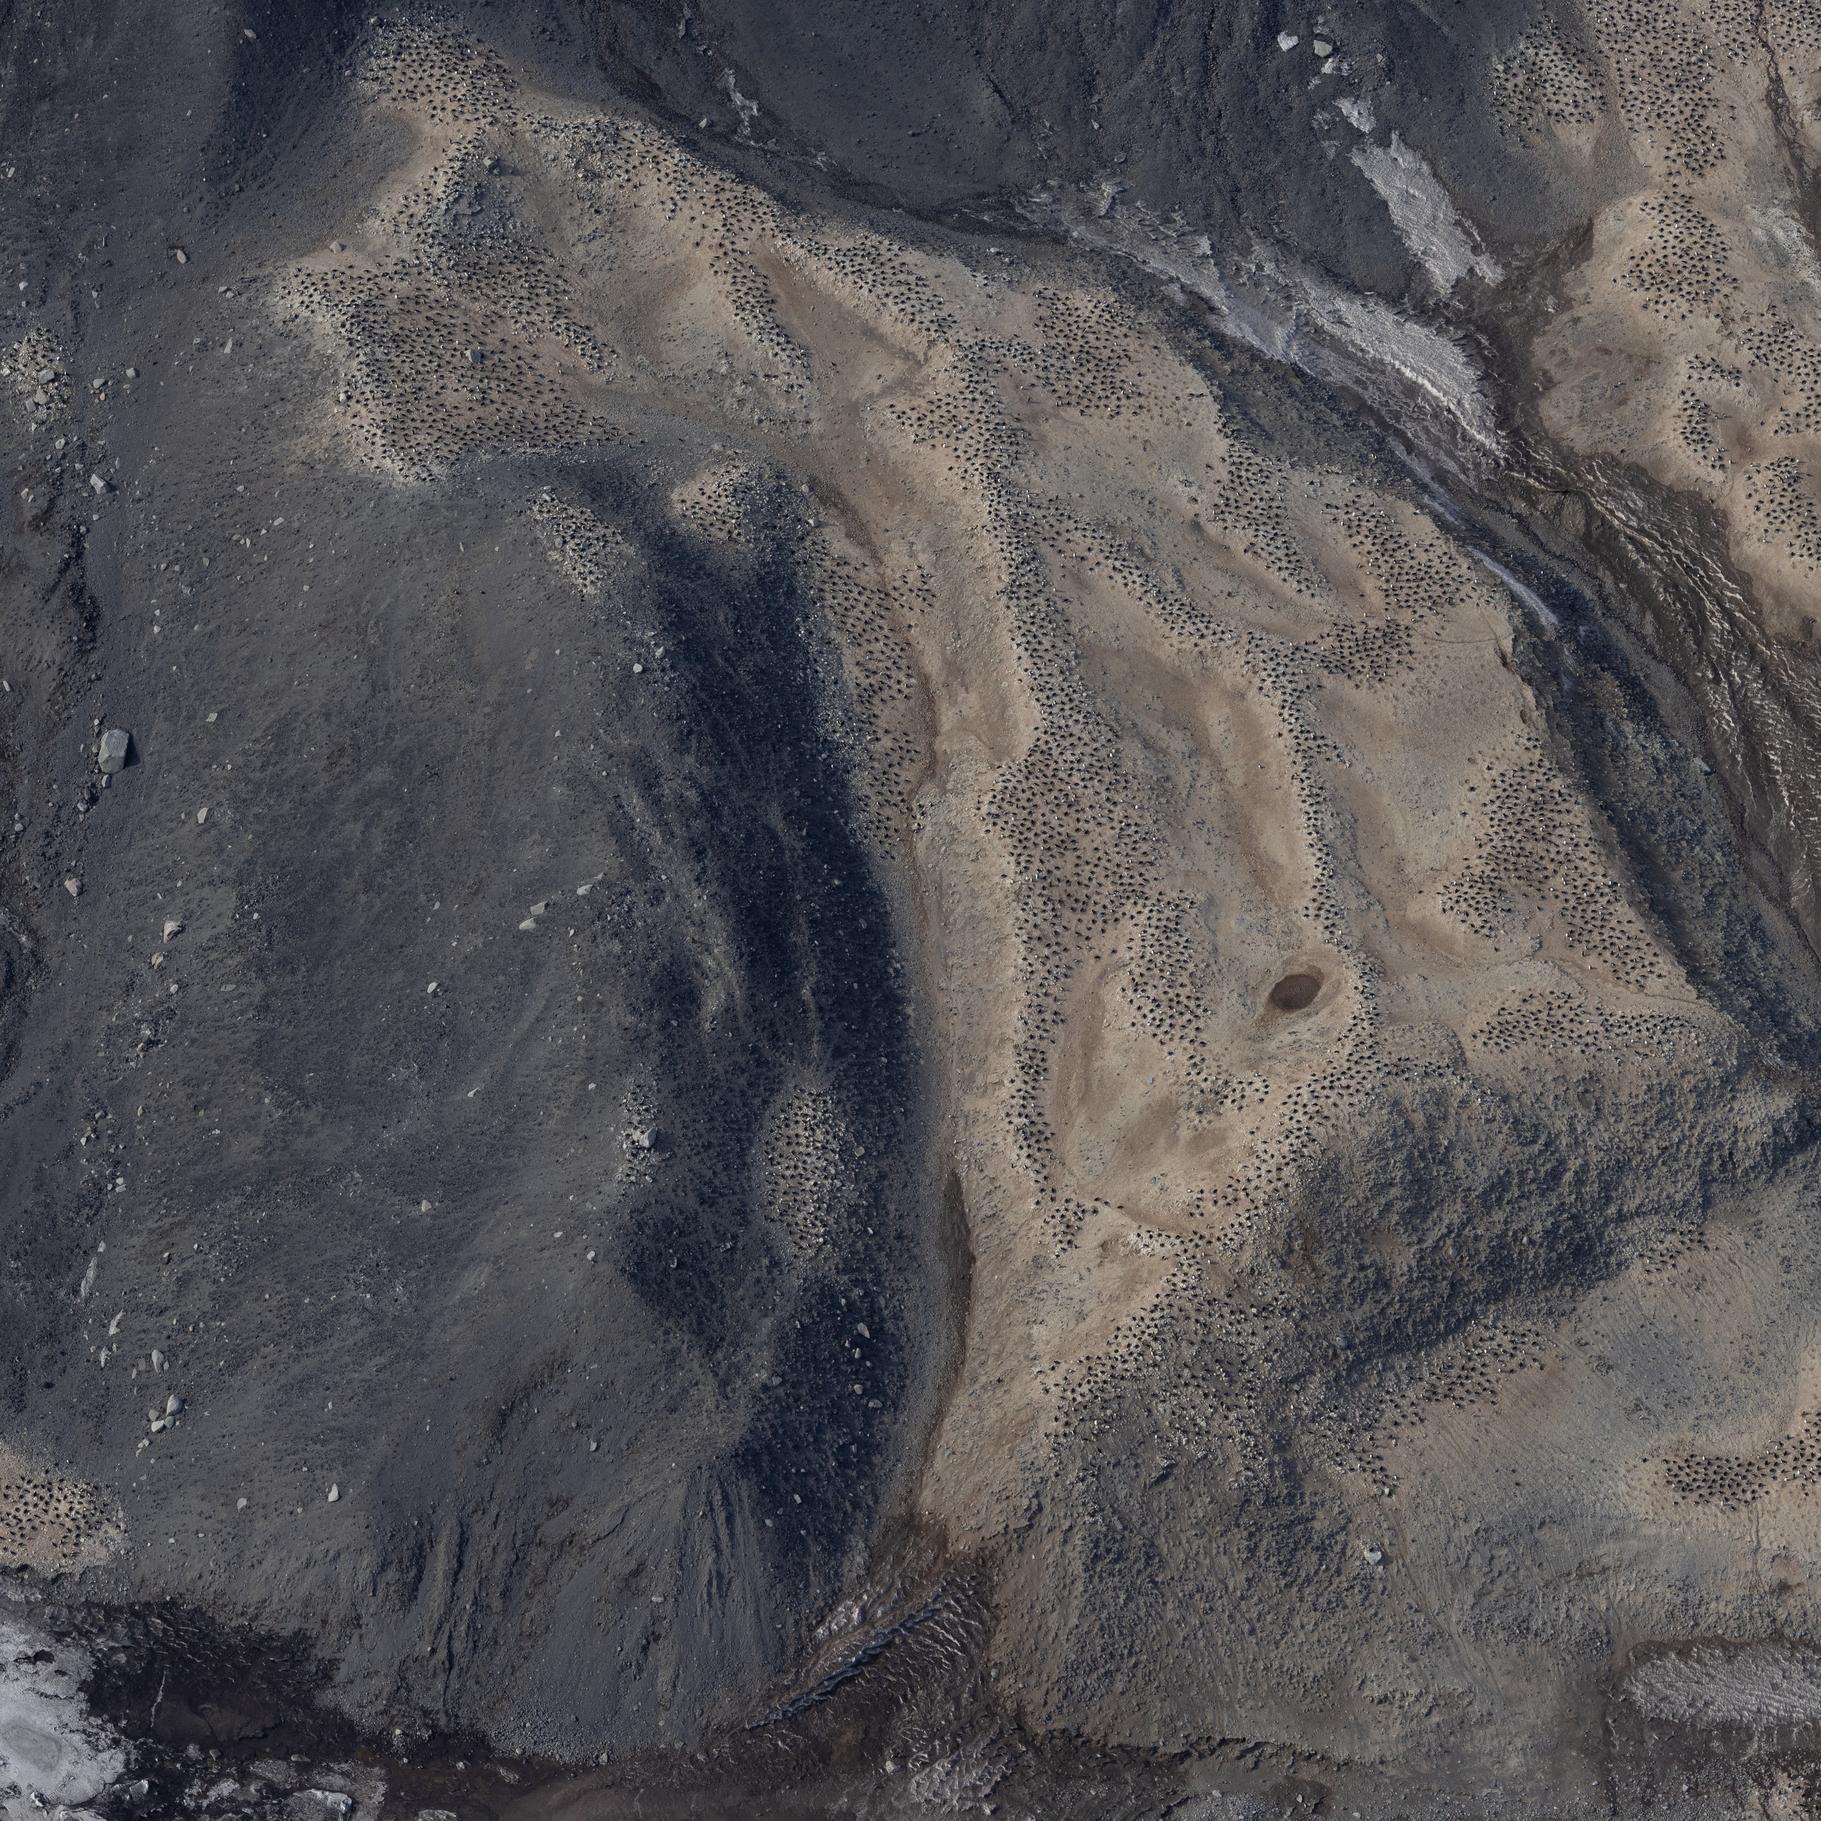
Raw images (over approximately 20.000 unique images) collected during the Adelie Penguin Census across 30+ colonies since 1981 (see associated metadata resource for list full list of colonies). Photographs were taken using a black and white film camera from 1981 to 2004 (inclusive) and 2008. Images are available in .tif fomrat. Images are digital from 2005 onwards (except 2008). Raw images are available in cr2/cr3 formats, and processed images are available across tif and jpg formats. High resolution scanning was initiated in 2011 to scan all the negatives in the collection. There are approximately 10,000 negatives in the collection. Images are taken from helicopter at between 2000-2500 feet. All images collected during the 2324 season are georeferenced with latitude and longitude positions in decimal degrees (WGS 84). Camera Settings: ISO = 400 Shutter speed = greater than 1/1000 Focus = manual, pre-focus to 800m Lens = 135mm with UV filter Aperture/ Exposure = F8 (or up to F11) Image Size = Full size White Balance Setting = Daylight Captures per minute = ~80 GET DATA: m.meredyth-young@antarcticanz.govt.nz
-
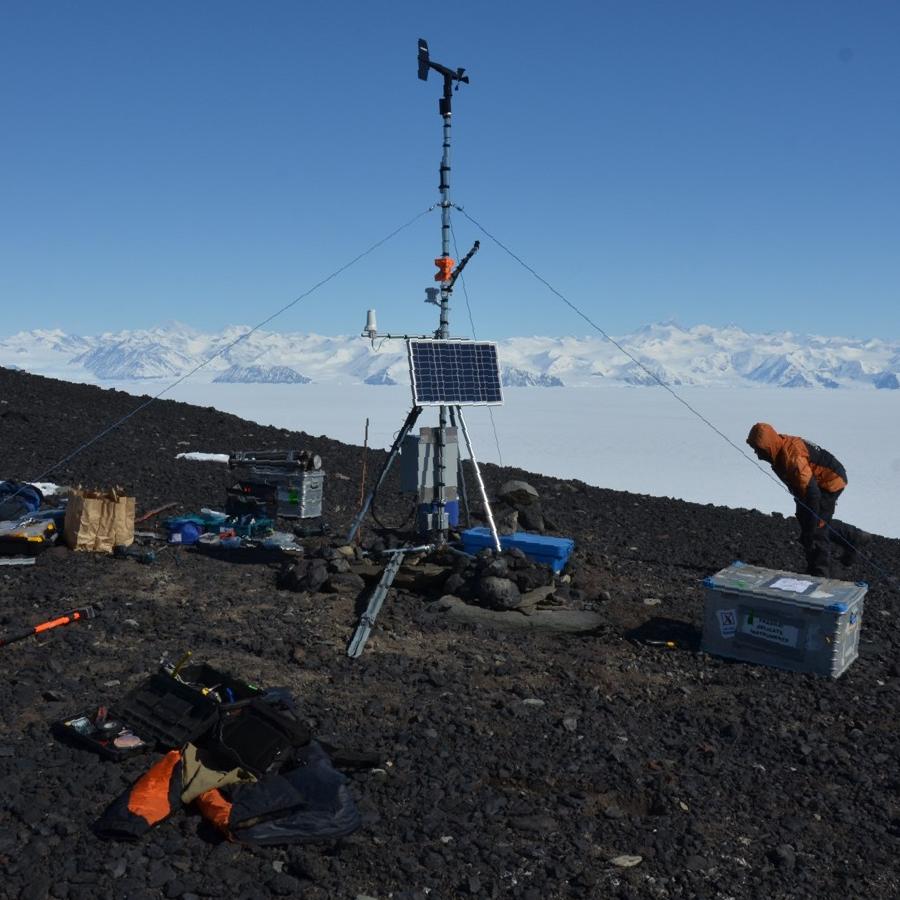
Two automated weather stations operates at Cape Adare . The station was established in 2014 and continues to transmit live data. Data are logged every 30 minutes. Time plotted is UTC+12. Cape Adare Ridge (-71.30498, 170.23253) Cape Adare Beach (-71.30820, 170.19580) Parameters: - Barometric Pressure (mbar) - Water Content - Surface (m^3/m) - Temperature – Surface (Deg C) - Temperature – Air (Deg C) - Relative Humidity - Air (%) - Solar Radiation (W/m^2) - Wind Speed (m/s) - Wind Gust Speed (m/s) - Wind Direction (true bearing degrees) GET DATA: adminteam@antarcticanz.govt.nz
-
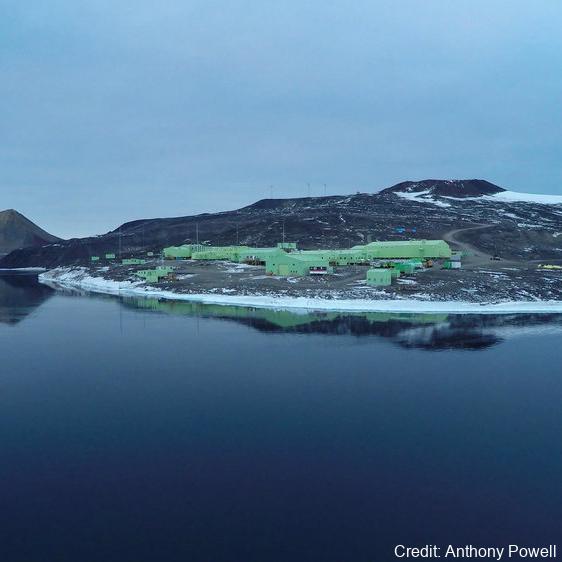
As part of the Scott Base Redevelopment Marine Monitoring Programme, the impact of Scott Base's activities on the local marine environment was assessed. Sampling took place at three sites around Hut Point Peninsula on the southern half of Ross Island during October – November 2019 to assess anthropogenic contamination. Two acoustic doppler current profilers (ADCP; Nortek Signature 500) were deployed, and set with a 2-minute sampling period in 1m vertical depth bins from the seabed to the underside of the ice. Instrument heads were kept ~0.5 m beneath the under-surface. ADCP data were downloaded, extracted from their raw formats, and averaged into 10-minute intervals. A magnetic declination of 141.09° E was applied to the measured current direction to correct the readings to reflect true north and a pressure offset was applied to standardise depths relative to ambient air pressure at the seawater surface. Information on habitats and benthic epifauna assemblage composition were collected using high resolution video across 2 25m transects at ~22m depth. Multiple overlapping passes were made across the seabed transects at ~0.5 m depth contours between ~20 – 26 m in order to create a 2D orthomosaic image of each site. Analysis of the diver-collected video was done using individual frames. The video along each transect was divided into 10 equal time segments and still frames were taken at random from the first, third, fifth, seventh and ninth segments. Eight video frames were analysed per transect (i.e., n=8 per transect and n=16 per site) by one individual to minimise observer bias. Sediment samples were collected by divers to determine contaminant concentrations and sediment characteristics (sediment particle size composition, organic matter content, organic carbon content and algal pigment content) at each site. Sponge species (Sphaerotylus antarcticus and Laternula elliptica) were collected for tissue contaminant analysis. Full description of methods is available at: https://doi.org/10.1007/s00300-023-03181-1 GET DATA: drew.lohrer@niwa.co.nz
-
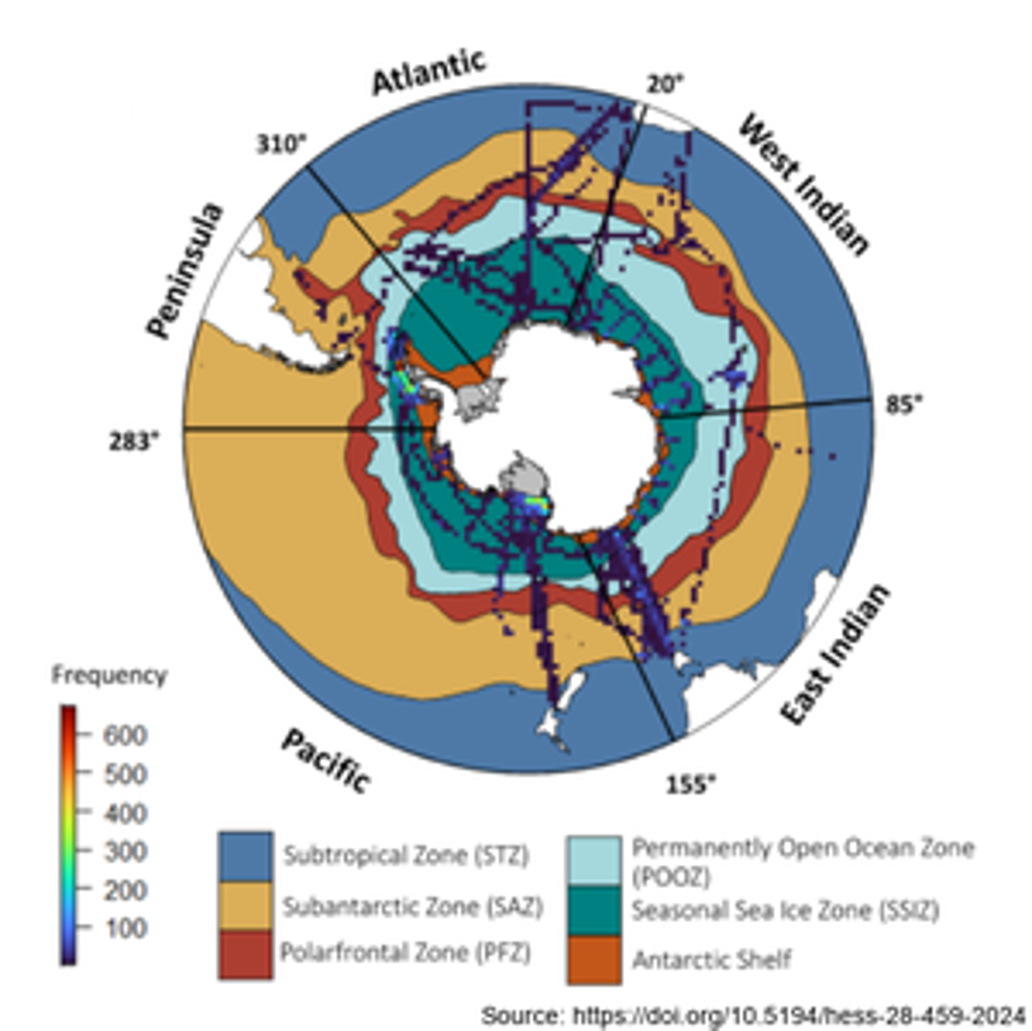
Here we analysed 26 years of pigment data (14,824 samples between 32°S and the Antarctic coast) from over 50 voyages (1996 – 2022), using the phytoclass software. The analysis confirms that the Antarctic Polar Front (APF) is a circumpolar phytoplankton class boundary, separating haptophyte dominated communities to the north from diatom domination of chlorophyll a in the south, and thereby a biological analogue corresponding to the Biogeochemical Divide. Further details can be found at : Hayward, A., Pinkerton, M.H., Wright, S.W. et al. Twenty-six years of phytoplankton pigments reveal a circumpolar Class Divide around the Southern Ocean. Commun Earth Environ 5, 92 (2024). https://doi.org/10.1038/s43247-024-01261-6
-
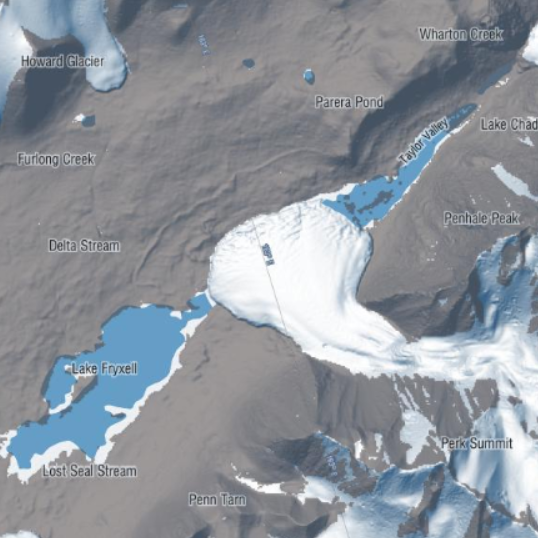
This metadata record represents meteorological data and in situ and isotopic measurements of the isotopic ratio of water vapor from the ablating ice from two lakes in the McMurdo Dry Valleys, Antarctica. Lake ice and water samples (from the surface water and at depth via SCUBA) were collected in vials. Ice samples at Lake Bonney were collected daily, and at Lake Fryxell samples were collected approximately twice per day. Lake ice samples were also collected at Lake Fryxell along three transects spaced approximately every 300 to 500 m (meters) across the lake surface. Water vapor isotope flux measurements were collected via air inlets which were installed at 0.5, 1.0, and 3.0 m on the tower using ¼″ OD Teflon tubes. The lines were insulated and continuously pumped at a flow rate of approximately 10 L min−1 using a secondary pump. Meteorological measurements with a Vaisala HMP100 probe for temperature and relative humidity readings and an RM Young wind vane (model 05108) for wind velocity measurements, at heights of 3.0 and 0.5 m. Air temperature, relative humidity, wind velocity, and lake surface temperature measurements were recorded every minute via a Campbell Scientific CR1000 data logger. Spatial Coordinates: Lake Bonney (-77.60672778, 162.44982222) Lake Fryxell (-77.60672778, 163.12508611) Further details are provided at: A. W. Bellagamba, M. Berkelhammer, L. Winslow, P. T. Doran, K. F. Myers, S. Devlin & I. Hawes (2021) The magnitude and climate sensitivity of isotopic fractionation from ablation of Antarctic Dry Valley lakes, Arctic, Antarctic, and Alpine Research, 53:1, 352-371, https://doi.org/10.1080/15230430.2021.2001899 GET DATA: https://uofi.app.box.com/s/6vakvltbsn1nhrpzudffclrn5iufpoux/folder/88268262341
-
The thicknesses of sea ice and sub-ice platelet layer were measured at regular intervals on fast ice in McMurdo Sound, Antarctica in November and December of 2011. Thirty-metre cross-profiles were established at each site, and snow depths were measured at 0.5 m intervals along the transect lines with a metal ruler. A mean snow depth for each site was derived from these 120 measurements. Freeboard, sea ice thickness and sub-ice platelet layer thickness were recorded at five locations at each site - at the central crossing point and at the end points of each transect. The mean of these was then calculated and taken as representative of the site. Ice thicknesses were measured by using a tape measure with a brass T-anchor attached at the zero mark. This was deployed vertically through the drill-hole and allowed to rotate to a horizontal alignment when exiting the bottom of the drill-hole at the ice-ocean interface. From this position the anchor is slowly pulled upwards until some resistance is met and the first measurement is taken. This resistance is taken to mark the sub-ice platelet layer/ocean interface. The tape measure is then pulled harder, forcing the bar to pass through the sub-ice platelet layer until it sits flush against the sea ice/sub-ice platelet layer interface where a second measurement is taken. Measurement sites were about 5 km apart.