 GeoData.NZ
ANTARCTICA
Type of resources
Available actions
Topics
Keywords
Contact for the resource
Provided by
Years
Representation types
Update frequencies
status
Scale
-
A tide gauge was installed in November 1990 and has been in near continuous operation since. A 10 minute average of water depth was recorded each hour with hourly averages of wind speed and direction, air temperature and solar radiation. From 2000 the recording frequency was increased from every hour to every 10 minutes. From 2003 data is read every 10 seconds and an average value (from 60 readings) is calculated every 5 minutes and recorded. Barometric pressure was measured as well, starting in 2003, with six barometric pressure readings made between 2 and 3 minutes in the 5-minute interval and averaged and recorded with the tide value. Each year the rise and fall of the sea ice is observed over a 2 - 3 day period during a spring tide using GPS. These measurements are related to a tide gauge bench mark and the sea surface to enable the reliability of the tide gauge to be checked. The tide gauge data is archived by Land Information New Zealand. GET DATA: https://sealevel-data.linz.govt.nz/index.html?tidegauge=ROBT
-

A sea level recorder and barometer was installed at Scott Base in January 2001 initially to support oceanographic and hazards research (including tsunami) and to support hydrographic surveying. The sea-level recorder is a nitrogen bubbler system with a paroscientific pressure transducer located on a bottom-mounted spigot of the osmosis boom (to enable lifting for maintenance), that ensures the orifice always returns to the same point. Sea level and atmospheric pressure and temperature are recorded at 5 minute intervals and stored every 24 hours. Each year the rise and fall of the sea ice is observed over a 2-3 day period during a spring tide using GPS. These measurements are related to a tide gauge benchmark and the sea surface to enable the reliability of the tide gauge to be checked. GET DATA: https://sealevel-data.linz.govt.nz/index.html?tidegauge=SCOT
-
Ultraviolet radiation measurements over the spectral region 290-450 nm with a high precision spectro-radiometer. The spectro-radiometer was installed at Arrival Heights as a two month (November 2006 – January 2007) blind inter-comparison with the established measurement programme run by Biospherical Instruments for the USAP. The data was compared with the USAP data taken simultaneously. These data are held internally by NIWA. GET DATA: contact dan.smale@niwa.co.nz
-
The Regional Geological Map and Data File (RGMAD) is a Nationally Significant Database and Collection for which GNS Science has custodianship. RGMAD is an archive of published and unpublished, hardcopy, and digital image and digital GIS format file geological maps for New Zealand, its offshore territories and Antarctica. The maps range from field sheets to draft compilations to complete maps as published. The collection includes maps dating back to the mid 19th century until the present and is regularly added to when new geological maps are completed. The hardcopy maps are stored in an archive facility at GNS Science's Lower Hutt building and some of the oldest maps are stored with the National Library. Most maps in the collection are available in digital formats; hardcopy maps have been scanned in high resolution during the 2010s, georeferenced and made available through a map image server. Vector GIS format maps created since the mid 1990s are stored on GNS Science servers and are available through web services and physical media sales. DOI: https://doi.org/10.21420/80GK-ZX10 Cite as: GNS Science. (1850). Regional Geological Map Archive and Data File(RGMAD) [Data set]. GNS Science. https://doi.org/10.21420/80GK-ZX10
-
The archive contains scanned images of published and unpublished, geological maps for New Zealand, its offshore territories and Antarctica. The maps range from field sheets to draft compilations to complete maps as published. The collection includes maps dating back to the mid 19th century until 2012. The hardcopy maps are stored in an archive facility at GNS Science's Lower Hutt building and some of the oldest maps are stored with the National Library. Most maps in the collection are available in digital formats; hardcopy maps have been scanned in high resolution during the 2010s, georeferenced and made available through a map image server. These maps represent the pre-2012 component of the Regional Geological Map Archive and Datafile, one of New Zealand Nationally Significant Collections and Databases, and complement more recent digital geological maps available from the Geological Map of New Zealand repository. DOI: https://doi.org/10.21420/Z8Z1-TR54 Cite as: GNS Science. (1850). Historic Geological Map Archive [Data set]. GNS Science. https://doi.org/10.21420/Z8Z1-TR54
-
Measurements of chlorine monoxide (ClO) made with a Microwave Chlorine Monoxide Millimeter Wave Spectrometer (ground-based). The instrument (ClOe1) was established in January of 1996 at Scott Base and decommissioned in October 2023. A replacement radiometer (ClOe4) was installed at Scott Base in February 2023 (an overlap in the data for timeseries continuity purposes). These data are produced in collaboration with State University of New York (SUNY) Stoney Brook and Naval Research Laboratory (NRL). “Raw” data are times and recorded microwave emission spectra. “Derived” data are column amounts and vertical profile information of chlorine monoxide (ClO). The instrument has acquired the nickname "CloeTechnique" for vertical profile information uses "optimal estimation" to extract information from pressure broadening of ClO emission line. Significant failure in early 2018 only fixed in November 2018. No data in the July - October 2018 period. Data is held at NRL and in the NDACC database. Data are available as monthly .ndm files, and additional metadata are available in the header. Instrument timeline: - ClOe1 1996-2023 - ClOe4 2023 – present GET DATA: https://www-air.larc.nasa.gov/missions/ndacc/data.html?station=scott.base#
-
Sea ice temperature (°C) measured across multiple depths at (LATITUDE: -77.792300, LONGITUDE: 166.514900). RELATED PUBLICATION: https://doi.org/10.1017/jog.2022.108 GET DATA: https://doi.org/10.1594/PANGAEA.880164
-
Sea ice temperature (°C) measured across multiple depths at (LATITUDE: -77.794900, LONGITUDE: 166.334700). RELATED PUBLICATION: https://doi.org/10.1017/jog.2022.108 GET DATA: https://doi.org/10.1594/PANGAEA.880165
-
Sea ice temperature (°C) measured across 11 depths (57 cm, 78.5 cm, 84.5 cm, 87.5 cm, 96.5 cm, 105.5 cm, 108.5 cm, 114.5 cm, 117.5 cm, 120.5 cm, 129.5 cm) at (LATITUDE: -77.781700, LONGITUDE: 166.315300): RELATED PUBLICATION: https://doi.org/10.1017/jog.2022.108
-
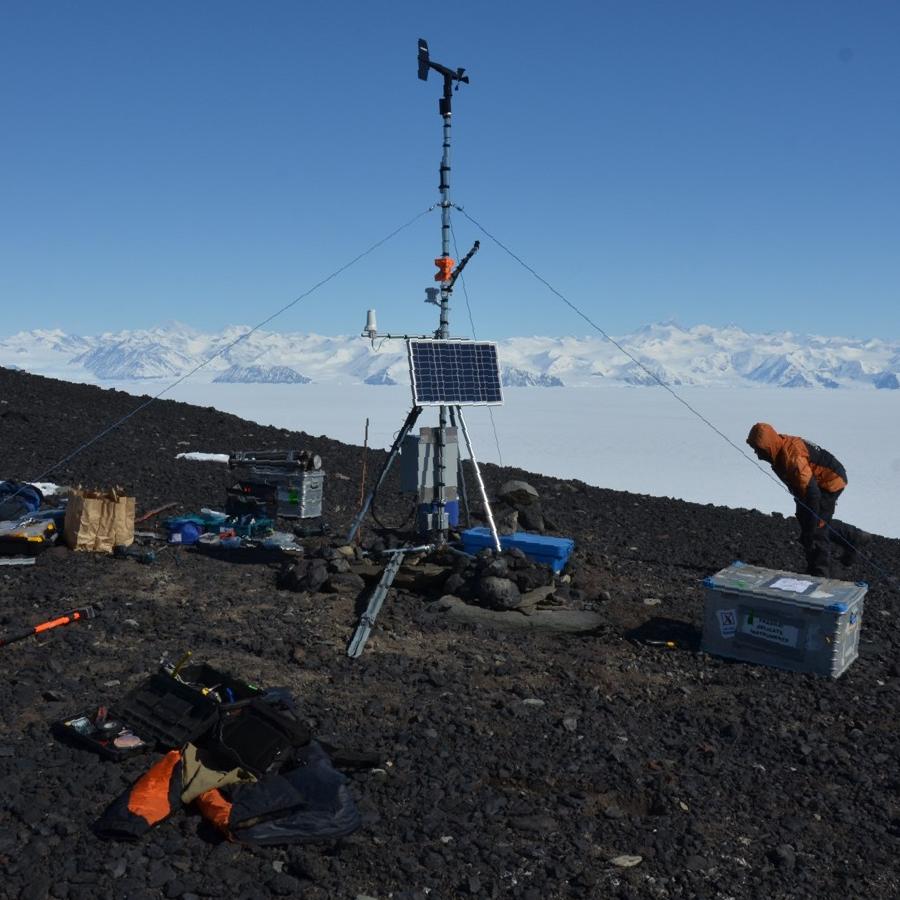
An automated weather station operates at Cape Adare (-71.30492, 170.23256). The station was established in 2014 and continues to transmit live data. Data are logged every 30 minutes. Parameters: - Air Temperature (C) - Relative Humidity (%) - Solar Radiation (W/m2) - PAR (uE) - Wind Speed (m/s) - Wind Gust (m/s) - Wind Direction (true bearing degrees) GET DATA: adminteam@antarcticanz.govt.nz