 GeoData.NZ
2024
Type of resources
Available actions
Topics
Keywords
Contact for the resource
Provided by
Years
Representation types
Update frequencies
status
Scale
-
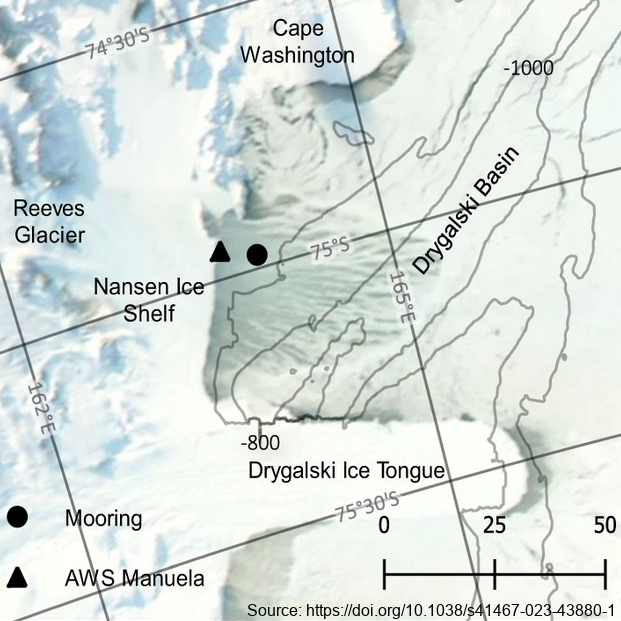
The mooring was deployed from February 2017 through February 2018 at 74.97° S, 163.96° E, approximately 7km east of the Nansen Ice Shelf in a region of TNB. The purpose of this study was to utilize data from a uniquely positioned and densely instrumented mooring to calculate HSSW production rates in TNB from continuous, in-situ observations. Moored instrumentation consisted of 7 SeaBird Electronics conductivity and temperature (SBE37-SM/SMP MicroCAT) sensors at depths of 47, 95, 119, 144, 168, 219, and 360 m and an upward-facing 600 kHz Nortek Acoustic Wave and Current (AWAC) profiler at 37 m depth, collecting both current velocity profiles in the upper ~35 m of the water column as well as Acoustic Surface Tracking (AST) measurements. Temperature and salinity measurements were validated against a shipboard conductivity-temperature-depth (CTD) cast performed upon deployment of the mooring. Temperature and salinity at 47 m and 95 m were additionally validated against a CTD cast performed upon recovery of the mooring. Full details of methods can be found in https://doi.org/10.1038/s41467-023-43880-1 GET DATA: ukm2103@columbia.edu
-
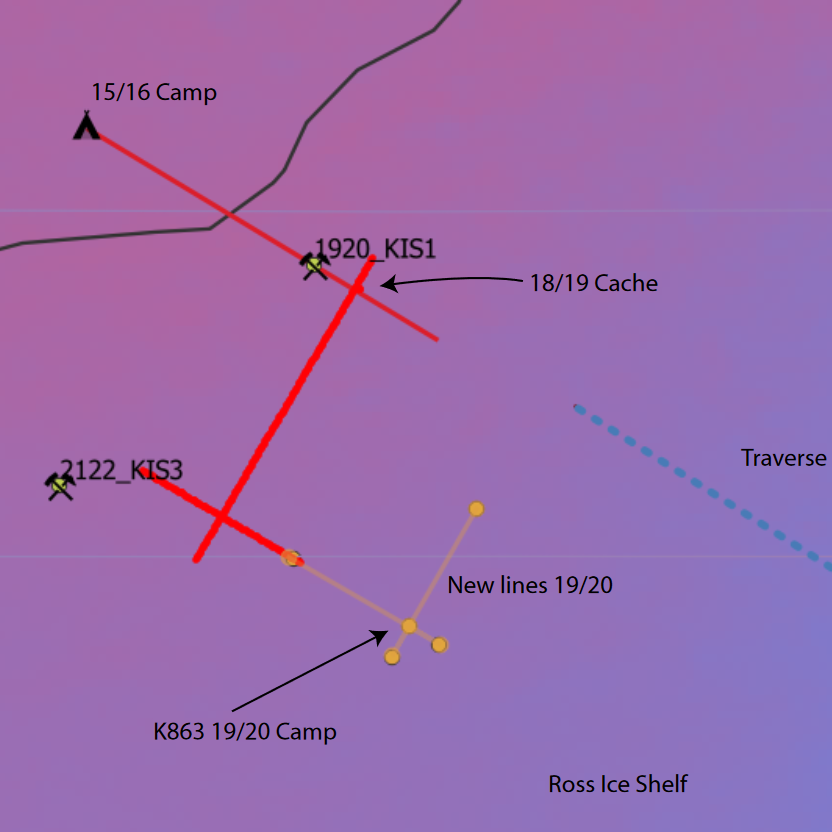
These data are described in detail by 'Melting and refreezing in an ice shelf basal channel at the grounding line of the Kamb Ice Stream. ApRES observations were made in December 2019 and repeated in December 2020 at the same locations. Data collection and processing followed the method described in Stewart et al. (2019). ApRES dataset.zip' contains raw ApRES data and processed results from a spatial survey of basal mass balance - detailed in Sections 2.2.4 and 3.2.2 of https://doi.org/10.1029/2021JF006532. GET DATA: https://doi.org/10.5281/zenodo.5574647
-
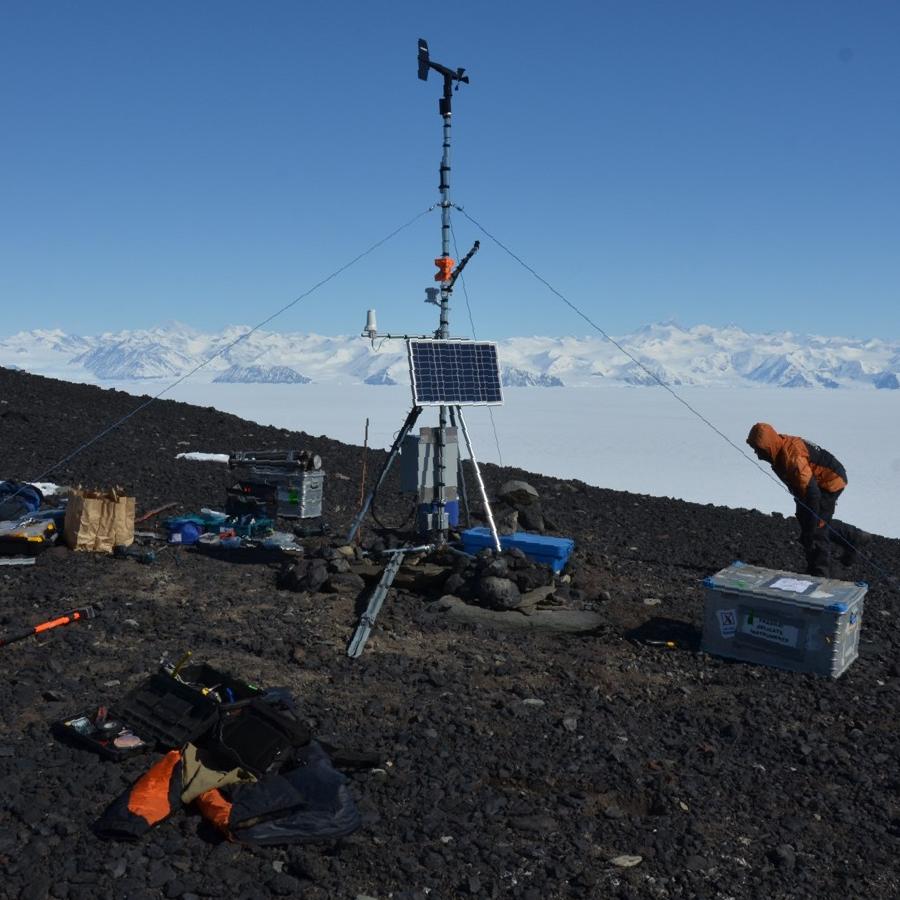
An automated weather station operates at Cape Adare (-71.30492, 170.23256). The station was established in 2014 and continues to transmit live data. Data are logged every 30 minutes. Parameters: - Air Temperature (C) - Relative Humidity (%) - Solar Radiation (W/m2) - PAR (uE) - Wind Speed (m/s) - Wind Gust (m/s) - Wind Direction (true bearing degrees) GET DATA: adminteam@antarcticanz.govt.nz
-
This dataset provides building outlines within mainland New Zealand extracted from multiple years of aerial imagery, allowing you to see change over time, or restrict the dataset to building outlines that match a specific aerial imagery source. A building outline is a 2D representation of the roof outline of a building which has been classified from LINZ aerial imagery using a combination of automated and manual processes to extract and refine a building roof outline. Building roof outlines observed in aerial imagery larger than or equal to 10 square meters are captured in this dataset, and may include structures such as garages and large sheds. **Data vintage** This dataset contains all building outlines which have been extracted from multiple years of aerial imagery available in each region of the country, including the most recent imagery. This dataset includes the dates for which each building existed in the aerial imagery. Current coverage includes nearly all regions of New Zealand, except parts of rural Auckland, remote parts of Bay of Plenty, Tasman and the Southern Alps, as well as Fiordland, Stewart Island and the Chatham Islands. This dataset will be updated and expanded as new aerial imagery becomes available. Please refer to the [NZ Building Outlines Data Dictionary](https://nz-buildings.readthedocs.io/en/latest/introduction.html) for detailed metadata and information about this dataset. **Related building outlines data** [NZ Building Outlines Lifecycle](https://data.linz.govt.nz/table/101291) – stores the relationship between building outlines when one building is split into two or more building outlines, or when multiple building outlines are merged into a single outline. Use this in conjunction with the NZ Building Outlines (All Sources) dataset. [NZ Building Outlines](https://data.linz.govt.nz/layer/101290) - provides current building outlines only, derived from the latest LINZ aerial imagery.
-

The data is generated through modelling simulations using the University of Victoria Earth system climate model. The modelling dataset presented here corresponds to the study entitled "Transient response of Southern Ocean ecosystems during Heinrich stadials". This dataset contains data files of the complete transient simulations (FW,FE and FWFE) and 40ka-control simulation mentioned in Table 1 and Table 2 of the manuscript. We first performed a control simulation 40ka-control integrating a total of 10000 years. We use only the last 200 years of this control simulation for our analysis. The data is generated through modelling simulations using the University of Victoria Earth system climate model. All the final data is in nc format, which can be easily read by Python/ferret or any other common data analysing software. RELATED PUBLICATION: Saini,H., Meissner,K.J., Menviel,L., & Kvale,K.(2024). Transient response of Southern Ocean ecosystems during Heinrich stadials. Paleoceanography and Paleoclimatology, 39, e2023PA004754. https://doi.org/10.1029/2023PA004754 GET DATA: https://doi.org/10.5061/dryad.k3j9kd5dt
-
The New Zealand Terrestrial Antarctic Biocomplexity Survey (nzTABS) is the largest and most comprehensive interdisciplinary landscape-scale study of terrestrial biology ever undertaken in Antarctica, incorporating fieldwork of 1500+ person days in 6 of the Dry Valleys (total area of 6500 km2), strategic sampling of over 1200 sites designed to encompass the landscape heterogeneities in the ecosystem, and a range of high-resolution remote sensing data. All samples were collected during the month of January in each sampling year. Initially a 220 km2 study area, consisting of Miers, Marshall, and Garwood Valleys as well as Shangri-La, was divided into more than 600 geographically and geologically distinct ice-free sectors (hereinafter “tiles”) using remote-sensing data and published soil maps. Tile boundaries were delineated where the combination of geographical and geological variables changed, and on-the-ground assessments were carried out in November 2008 to confirm the reliability of delineations. 554 tiles were chosen for sampling to encompass the entire range of geographical and geological heterogeneity. Sampling of soils and biological communities was carried out over two successive austral summers (January 2009 and January 2010). Surveys were conducted for vegetation (i.e., mosses, lichens, algal and cyanobacterial mats), lithic microbial communities, and invertebrates at each sampling site (verified by GPS to be inside its respective tile), followed by collection of bulk soil samples for additional analyses, including molecular analyses of bacteria (total and cyanobacteria-only) and fungi. In addition, a number of key variables were derived from satellite imagery, including surface soil temperature, a topographically derived ‘wetness index’, and distance to the coast. After quality control, data for 490 samples were included in the analysis. These data represent geochemistry and geomorphology to population genetics and microbial ecology parameters. Further details are provided at https://doi.org/10.1038/s42003-018-0274-5. Please cite the data with the following citation: Lee, C.K., Laughlin, D.C., Bottos, E.M. et al. Biotic interactions are an unexpected yet critical control on the complexity of an abiotically driven polar ecosystem. Commun Biol 2, 62 (2019). https://doi.org/10.1038/s42003-018-0274-5
-
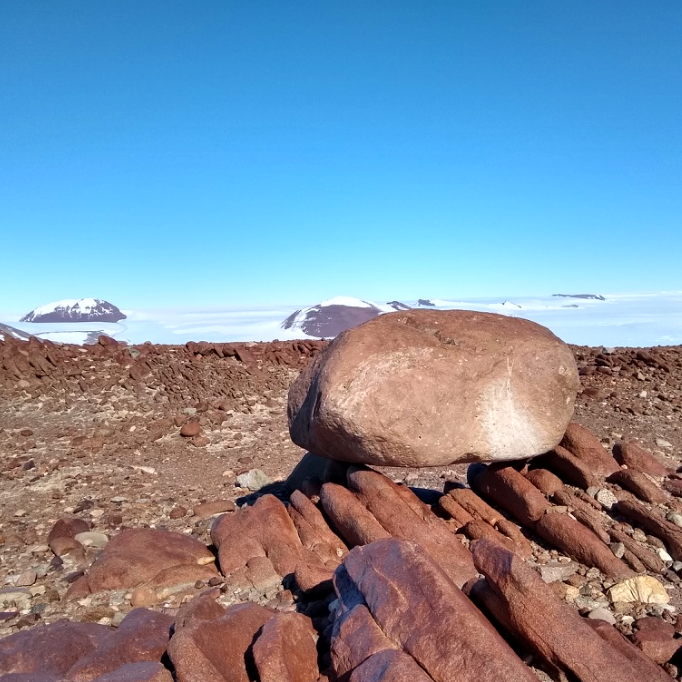
Cosmogenic surface exposure chronologies were used to quantitatively constrain past rates of ice thinning, and the absolute timing of ice discharge and thinning events. We sampled glacial erratics and bedrock from Byrd Glacier (LW1 Nunatak, LW2 Nunatak, Lonewolf Nuntataks, Tiger Nunatak, Mt. Tadpole). Samples were analysed for their exposure history, and all sites contained glacial erratics. In particular, the Lonewolf Nunataks sites, which is located along the margin of the East Antarctic Ice Sheet revealed a plethora of glacial cobbles. Details of laboratory procedures can be found in the related publication. RELATED PUBLICATION: https://doi.org/10.1002/esp.5701 GET DATA: https://version2.ice-d.org/antarctica/publication/1139/
-
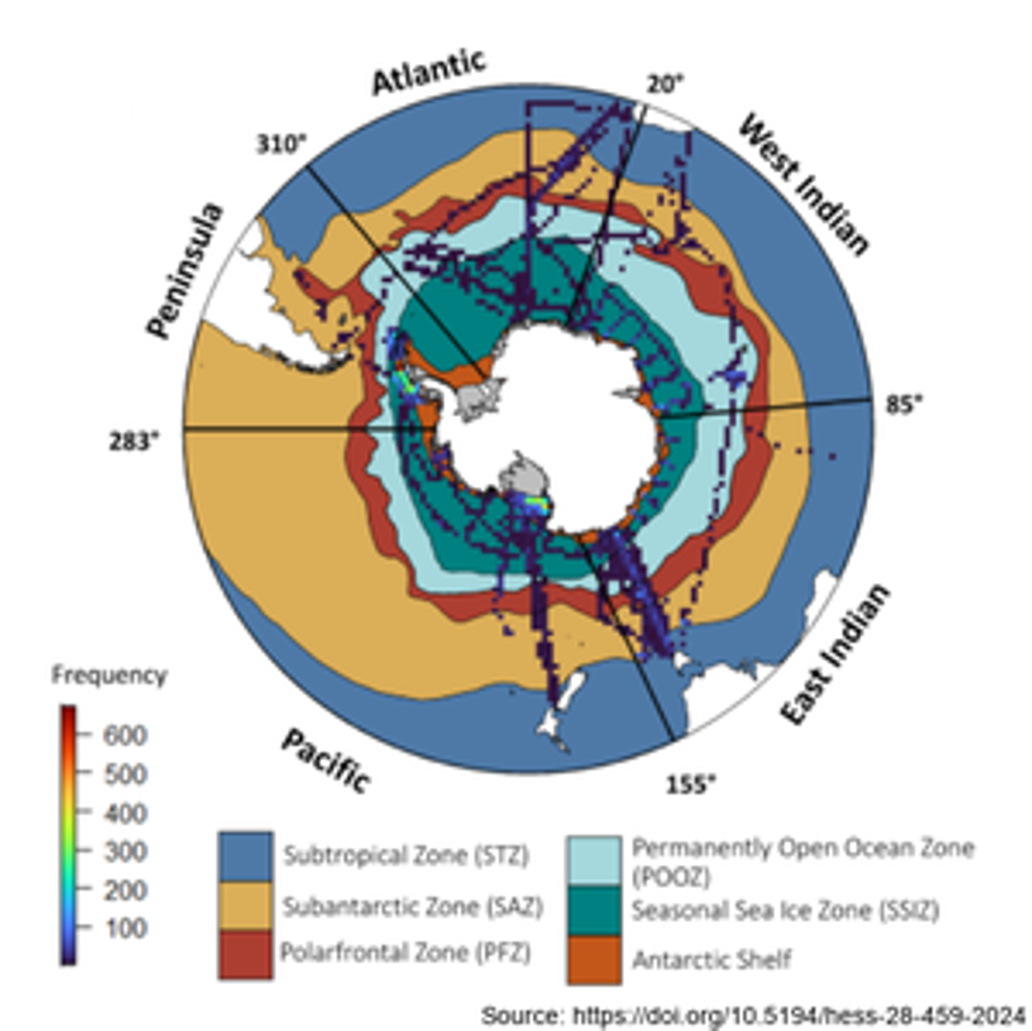
Here we analysed 26 years of pigment data (14,824 samples between 32°S and the Antarctic coast) from over 50 voyages (1996 – 2022), using the phytoclass software. The analysis confirms that the Antarctic Polar Front (APF) is a circumpolar phytoplankton class boundary, separating haptophyte dominated communities to the north from diatom domination of chlorophyll a in the south, and thereby a biological analogue corresponding to the Biogeochemical Divide. Further details can be found at : Hayward, A., Pinkerton, M.H., Wright, S.W. et al. Twenty-six years of phytoplankton pigments reveal a circumpolar Class Divide around the Southern Ocean. Commun Earth Environ 5, 92 (2024). https://doi.org/10.1038/s43247-024-01261-6
-
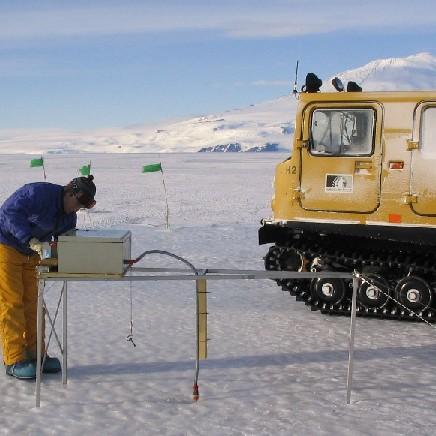
Data provided here have been collected as part of the project "Measurements and Improved Parameterization of the Thermal Conductivity and Heat Flow through First-Year Sea Ice", OPP-0126007* and include measurements of temperature and various ice properties at selected sites in first-year and multiyear sea ice in McMurdo Sound, Antarctica in the years 2002-2004. Data from earlier installations of thermistor chains for measurements of ice temperature carried out by the New Zealand team have also been included. Data files are in Microsoft Excel format, with individual worksheets for specific cores or temperature data sets. Detailed information and comments on data sampling location etc. are provided in the files. Further information on data collection, results etc. can be found in the following publications: Backstrom, L. G. E., and H. Eicken 2007, submitted, Capacitance probe measurements of brine volume and bulk salinity in first-year sea ice, Cold Reg. Sci. Tech. Pringle, D. J., H. Eicken, H. J. Trodahl, and L. G. E. Backstrom 2007, submitted, Thermal conductivity of landfast Antarctic and Arctic sea ice, J. Geophys. Res. Trodahl, H. J., S. O. F. Wilkinson, M. J. McGuinness, and T. G. Haskell 2001, Thermal conductivity of sea ice; dependence on temperature and depth, Geophys. Res. Lett., 28, 1279-1282. Data are in Microsoft Excel format. Abbreviations: AH = Arrival Heights; CH = Camp Haskell (near Delbridge Islands); VUW = Victoria University Wellington; UAF = University Alaska Fairbanks. RELATED PUBLICATION: https://doi.org/10.1017/jog.2022.108 GET DATA: https://drive.google.com/drive/folders/1ooUH9dPvWT66afFC51Cb0JOHg66rn0sy
-
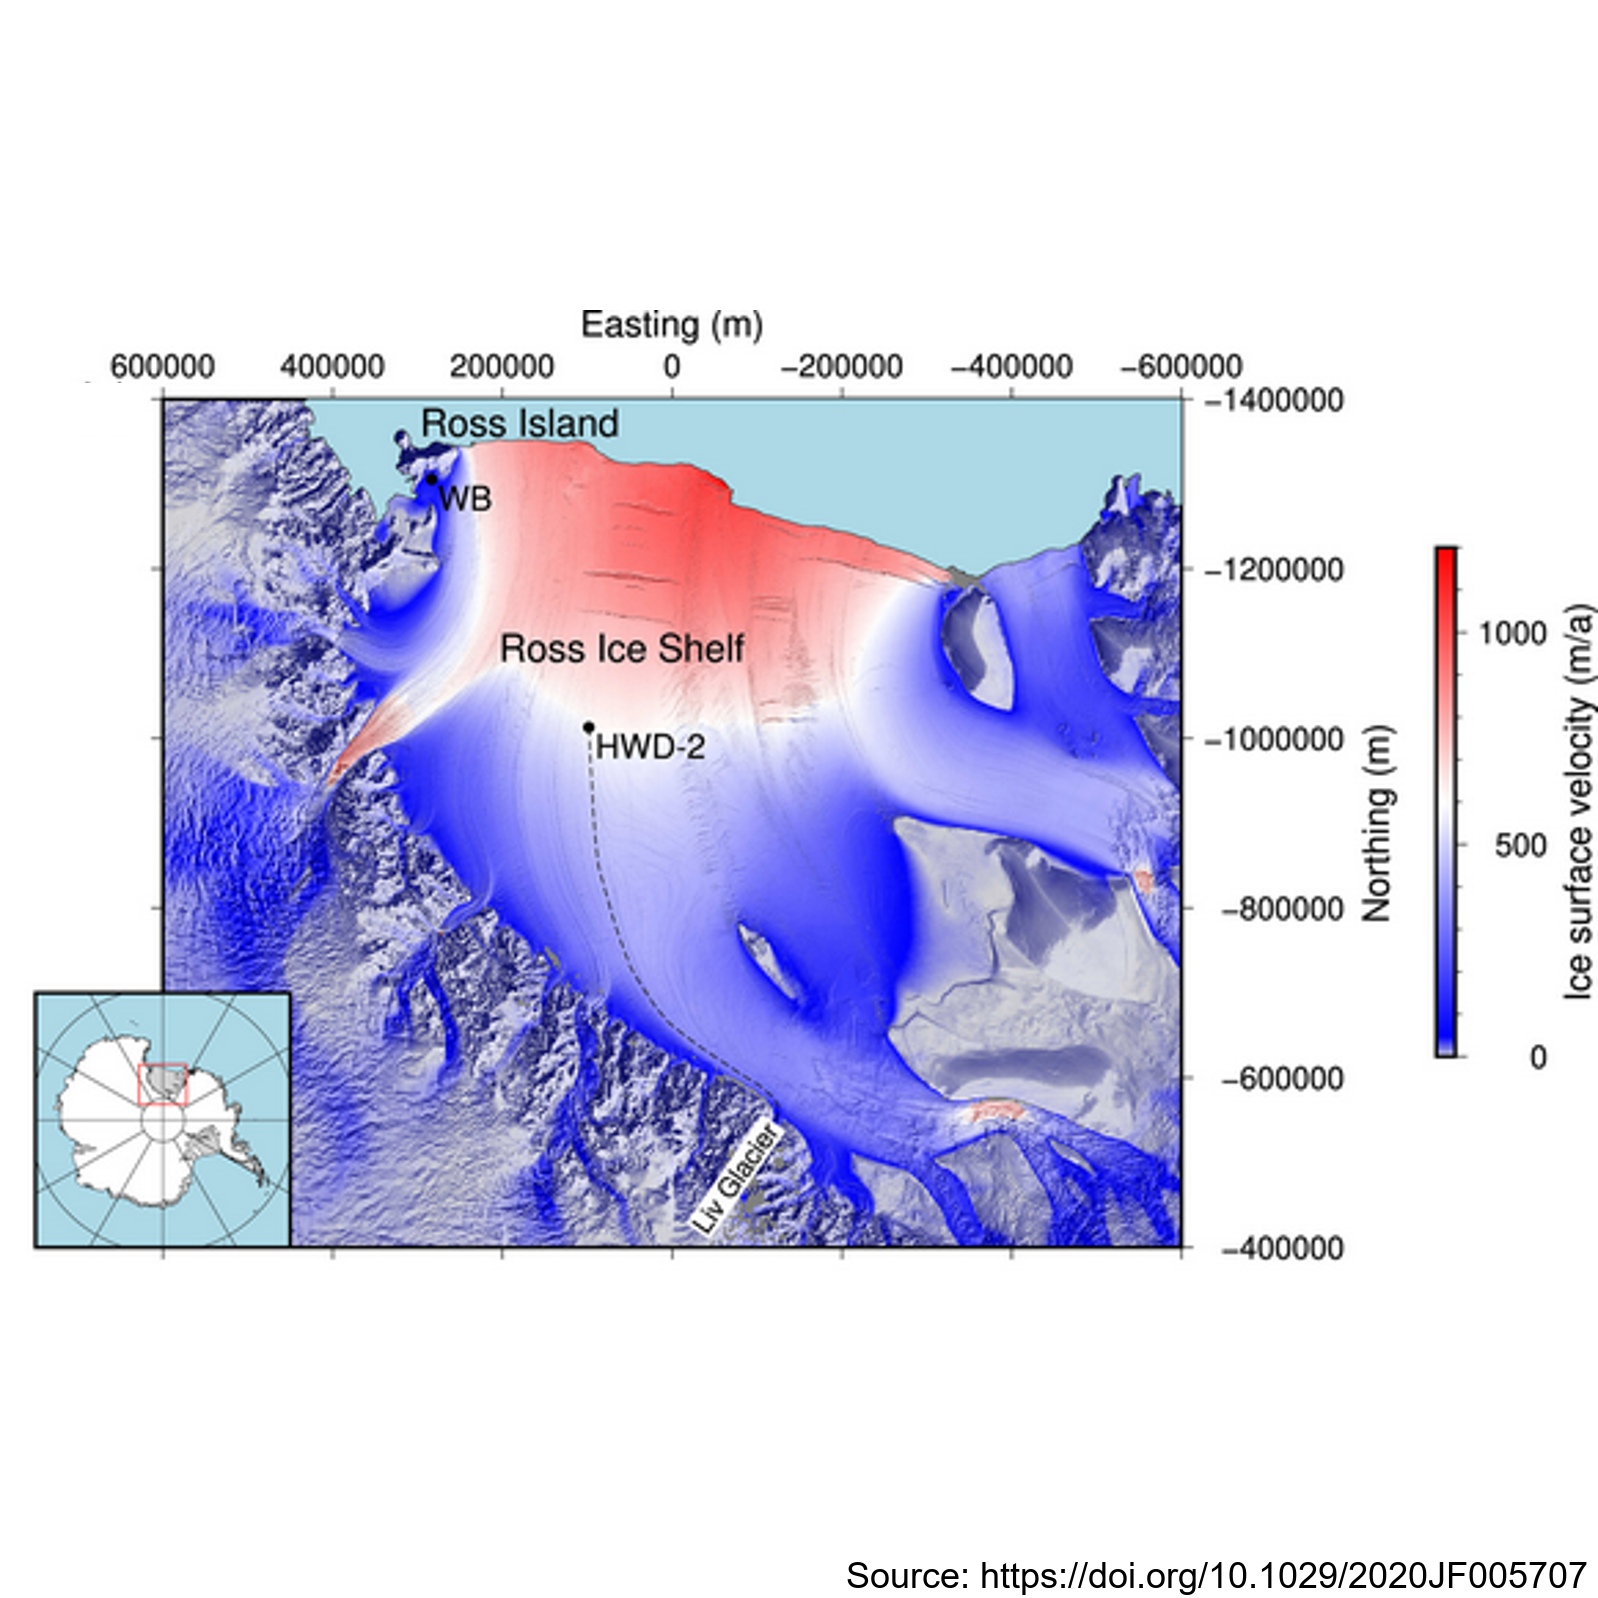
This metadata record presents observations of ice shelf anisotropy derived from borehole seismic data. Hot-water-drilled boreholes were created at two sites: Windless Bight (WB) near the grounding line on Ross Island and HWD-2 in the central Ross Ice Shelf. The boreholes housed seismometers frozen at various depths within the ice, enabling seismic observations of shear wave splitting (SWS) using active seismic sources. At Windless Blight, borehole seismometers were installed at depths of 40 and 190 meters within the ∼220 m thick ice shelf during the 2016/2017 Antarctic field season. Seismic shots were recorded with a 2,000 Hz sampling rate and a 2 s record length, triggered by striking plates. The site was revisited in December 2017 to validate sensor survivability and reproduce survey geometry for SWS analysis using multiazimuth shots. At HWD-2, eight seismometers were deployed at depths ranging from 80 to 325 meters inside the ∼370 m thick ice shelf during the 2017/2018 field season. A total of 747 shots at 53 different shot points were recorded, with clear observations of split shear waves in the data. The study contributes valuable seismic data and methodology for understanding ice shelf anisotropy, enhancing our knowledge of Antarctic ice dynamics and seismic behavior. Further details are provided at: Lutz, F., Eccles, J., Prior, D. J., Craw, L.,Fan, S., Hulbe, C., et al. (2020). Constraining ice shelf anisotropy using shear wave splitting measurements from active‐source borehole seismics.Journal of Geophysical Research: EarthSurface,125, e2020JF005707. https://doi.org/10.1029/2020JF005707 GET DATA: https://auckland.figshare.com/s/9f783802272b825d7ad7