 GeoData.NZ
oceans
Type of resources
Available actions
Topics
Keywords
Contact for the resource
Provided by
Years
Formats
Representation types
Update frequencies
status
Scale
Resolution
-
This layer contains depth information in gridded format captured by multibeam sonar in 2012/13 as part of HS39 - Bay of Plenty. The data was collected for Toitū Te Whenua Land Information New Zealand (LINZ) and for which the survey took place from 24 October 2012 to 21 March 2013. Data management and distribution is by LINZ. Data comprises a gridded depth model as tif or ascii tiles in UTM projection. Vertical accuracy is +/- 0.2m (95%) Horizontal accuracy is +/- 0.7m (95%) Vertical datum is Approximate Lowest Astronomical Tide. The source data used to create the depth model may be of a higher resolution/density than the model. This data can be supplied on request and available resolutions be discovered through the [NZ Bathymetric Surface model Index](https://data.linz.govt.nz/layer/95574-nz-bathymetric-surface-model-index/).
-
This layer contains depth information in gridded format captured by multibeam sonar in 2005 as part of P3001 - Bounty and Antipodes Islands Hydrographic Survey. The data was collected for Toitū Te Whenua Land Information New Zealand (LINZ) and for which the survey took place from 25 March to 8 April 2005. Data management and distribution is by LINZ. Data comprises a gridded depth model as tif or ascii tiles in UTM projection. Vertical accuracy is +/- 1.14m (95%) Horizontal accuracy is +/- 3.04m (95%) Vertical datum is Approximate Lowest Astronomical Tide. The source data used to create the depth model may be of a higher resolution/density than the model. This data can be supplied on request and available resolutions be discovered through the [NZ Bathymetric Surface model Index](https://data.linz.govt.nz/layer/95574-nz-bathymetric-surface-model-index/).
-
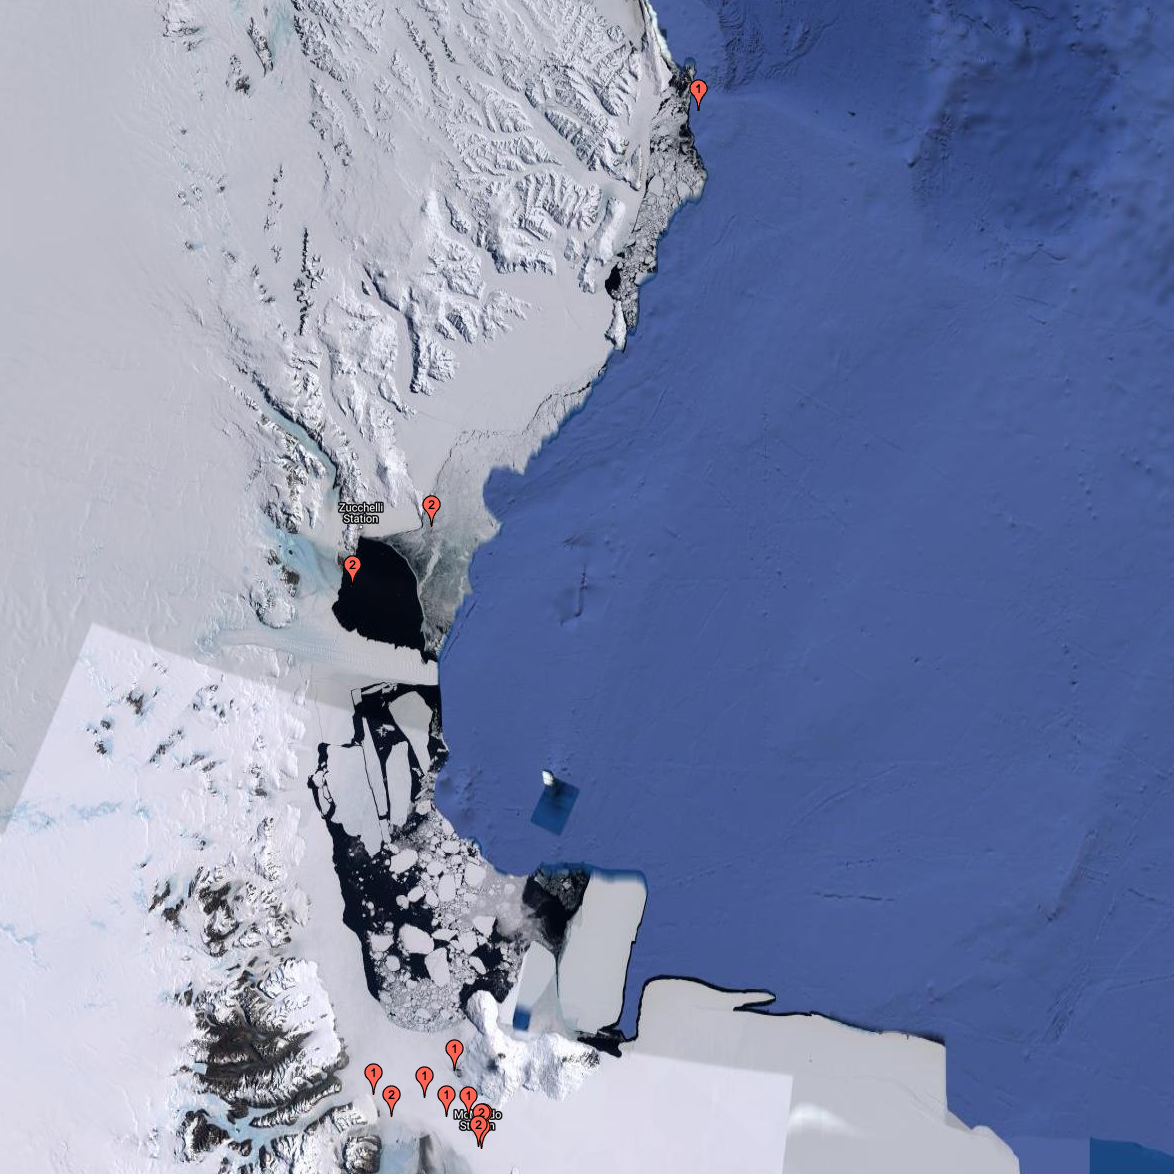
Data of apparent ice thickness from airborne electromagnetic (AEM) surveys of fast ice in McMurdo Sound, Antarctica, carried out in Nov/Dec 2009, 2011, 2013, 2016, and 2017. Values are given for apparent thicknesses derived from both, in-phase and quadrature signals. The difference between both thicknesses is a scaled measure of sub-ice platelet layer thickness. Data are from east-west transects across McMurdo Sound, at fixed latitudes. Data were smoothed and interpolated onto a regular longitude grid (0.001 degree increments). More information can be found in Haas et al. (2021). Related Publication: Haas, C., Langhorne, P. J., Rack, W., Leonard, G. H., Brett, G. M., Price, D., Beckers, J. F., and Gough, A. J.: Airborne mapping of the sub-ice platelet layer under fast ice in McMurdo Sound, Antarctica, The Cryosphere, 15, 247–264, https://doi.org/10.5194/tc-15-247-2021, 2021
-
This layer contains depth information in gridded format captured by multibeam sonar in 2008 as part of Auckland Explosives Dumping Ground Hydrographic Survey. The data was collected for Toitū Te Whenua Land Information New Zealand (LINZ) and for which the survey took place from 2 February to 10 February 2008. Data management and distribution is by LINZ. Data comprises a gridded depth model as tif or ascii tiles in UTM projection. Vertical accuracy is +/- 0.7m (95%) Horizontal accuracy is +/- 4.3m (95%) Vertical datum is Approximate Lowest Astronomical Tide. The source data used to create the depth model may be of a higher resolution/density than the model. This data can be supplied on request and available resolutions be discovered through the [NZ Bathymetric Surface model Index](https://data.linz.govt.nz/layer/95574-nz-bathymetric-surface-model-index/).
-
Full-depth CTD profiles taken on along-sound and cross-sound transects of McMurdo Sound. Eleven stations with six independent sites were visited. Potential temperature (theta) (measured); Units: °C; Observation Type: in situ; Sampling Instrument: CTD - specific model; Sampling and Analyzing Method: SBE19+ CTD profiler SALINITY (measured); Units: psu; Observation Type: in situ; Sampling Instrument: CTD - specific model; Sampling and Analyzing Method: SBE19+ CTD profiler PRESSURE - WATER [HYDROSTATIC PRESSURE] (measured); Units: dbar; Observation Type: in situ; Sampling Instrument: CTD - specific model; Sampling and Analyzing Method: SBE19+ CTD profiler GET DATA: https://data.noaa.gov/onestop/collections/details/293bf93a-9d10-42df-b468-27fc726b2330
-
This layer contains depth information in gridded format captured by multibeam sonar in 2021. The data was collected for Toitū Te Whenua Land Information New Zealand (LINZ) and for which the survey took place from 18 November to 14 December 2021. Data management and distribution is by LINZ. Data comprises a gridded depth model as tif or ascii tiles in UTM projection. Vertical accuracy is +/- 0.5m (95%) Horizontal accuracy is +/- 1m (95%) Vertical datum is Approximate Lowest Astronomical Tide. The source data used to create the depth model may be of a higher resolution/density than the model. This data can be supplied on request.
-
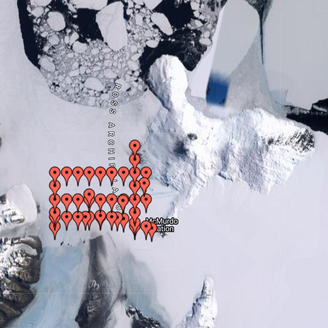
The thicknesses of sea ice and sub-ice platelet layer were measured at regular intervals on fast ice in McMurdo Sound, Antarctica in November and December of 2011. Thirty-metre cross-profiles were established at each site, and snow depths were measured at 0.5 m intervals along the transect lines with a metal ruler. A mean snow depth for each site was derived from these 120 measurements. Freeboard, sea ice thickness and sub-ice platelet layer thickness were recorded at five locations at each site - at the central crossing point and at the end points of each transect. The mean of these was then calculated and taken as representative of the site. Ice thicknesses were measured by using a tape measure with a brass T-anchor attached at the zero mark. This was deployed vertically through the drill-hole and allowed to rotate to a horizontal alignment when exiting the bottom of the drill-hole at the ice-ocean interface. From this position the anchor is slowly pulled upwards until some resistance is met and the first measurement is taken. This resistance is taken to mark the sub-ice platelet layer/ocean interface. The tape measure is then pulled harder, forcing the bar to pass through the sub-ice platelet layer until it sits flush against the sea ice/sub-ice platelet layer interface where a second measurement is taken. Measurement sites were about 5 km apart.
-
Sea ice temperature (°C) measured across multiple depths at (LATITUDE: -77.792300, LONGITUDE: 166.514900). Related Publication: Richter ME, Leonard GH, Smith IJ, Langhorne PJ, Mahoney AR, Parry M. Accuracy and precision when deriving sea-ice thickness from thermistor strings: a comparison of methods. Journal of Glaciology. 2023;69(276):879-898. doi:10.1017/jog.2022.108 GET DATA: https://doi.org/10.1594/PANGAEA.880164
-

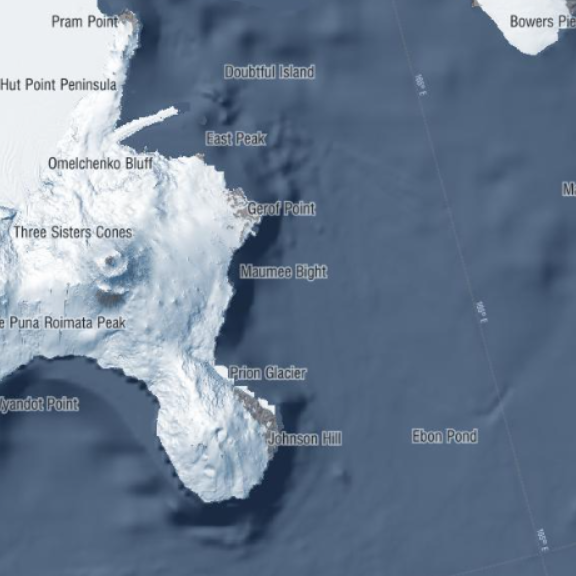
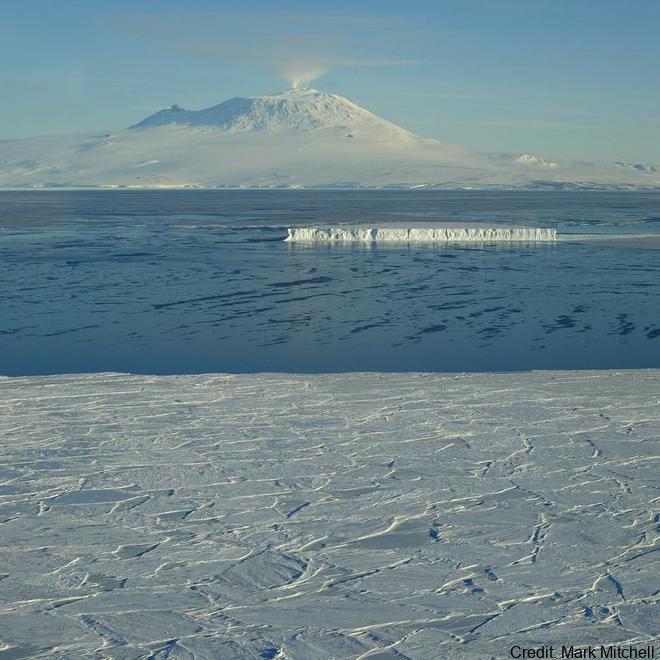
This metadata record represents environmental data at Cape Evans. Conductivity, temperature, depth (CTD), photosynthetically active radiation (PAR), and currents were measured at ~20-meter depth for 12 months to characterise variability in the nearshore habitat. These instruments form part of the Antarctic Nearshore and Terrestrial Observation Systems (ANTOS). The combined analyses of coastal currents and sea ice conditions with genetic and trophic data were used to understand the influence of key drivers on the interconnectedness of existing Ross Sea populations, and on the resilience of key benthic species to environmental change. The data will be made available at the ANTOS website: https://antosdb.org Mooring Coordinates: Cape Evans (-77.63491667, 166.41405) GET DATA: vonda.cummings@niwa.co.nz
-
PAR (Oddesey) and temperature sensors (Hobo) were deployed in the ice under red, green, and blue acrylic sheets to examine the response of rhodopsin-bearing cells to environmental stress. Sensors were placed near the top, middle and bottom of the sea ice and left in place for 2 weeks. GET DATA: ken.ryan@vuw.ac.nz