 GeoData.NZ
2022
Type of resources
Available actions
Topics
Keywords
Contact for the resource
Provided by
Years
Formats
Representation types
Update frequencies
status
Scale
Resolution
-
Index Tiles ONLY, for actual orthophotos see layer [Bay of Plenty 0.1m Urban Aerial Photos (2022-2023)](http://data.linz.govt.nz/layer/114159) Orthophotography within the Bay of Plenty Region captured in the flying season of 2022-2023. Coverage encompasses 43 urban areas in the Bay of Plenty region. Imagery was captured for BOPLASS Limited by Woolpert NZ Ltd (formerly AAM NZ Ltd), 6 Ossian St, Napier, New Zealand. Data comprises: • 2684 ortho-rectified RGB GeoTIFF images in NZTM projection, tiled into the LINZ Standard 1:1000 tile layout. • Tile layout in NZTM projection containing relevant information. The supplied imagery is in terms of New Zealand Transverse Mercator (NZTM) map projection. Imagery supplied as 10cm pixel resolution (0.1m GSD), 3-band (RGB) uncompressed GeoTIFF. The final spatial accuracy is ±0.25 at 95% confidence level in clear flat areas.
-
A GOCAD T-surf mesh that defines the volume of the Tukituki Rivermouth gravel (Tollemache Member) geological unit. It has been derived from the 3D geological model of the Napier-Hastings urban area which forms part of GNS Geological Map 7. The 3D model was built using Leapfrog Geo software. This dataset forms part of Begg JG, Jones KE, Lee JM, Tschritter C. 2022. 3D geological model of the Napier-Hastings urban area [digital data]. Lower Hutt (NZ): GNS Science. (GNS Science geological map; 7b). https://doi.org/10.21420/JJEC-J652. The explanatory text associated with this dataset is available from https://doi.org/10.21420/QFEK-9369.
-
Orthophotography within the Canterbury Region captured in the flying season of 2022-2023. Coverage encompasses locations within the Timaru District including Geraldine, Orari, Winchester, Temuka, Pleasant Point, Timaru city, and Pareora. Imagery was captured for Environment Canterbury by Landpro Ltd between the 29 December 2022 and 2 March 2022. Data comprises: • 1176 ortho-rectified RGB GeoTIFF images in NZTM projection, tiled into the LINZ Standard 1:500 tile layout. • Tile layout in NZTM projection containing relevant information. Imagery supplied with a 7.5cm pixel resolution (0.075m GSD). Also available on: • [LINZ Basemaps](https://basemaps.linz.govt.nz/@-44.2825704,171.2109375,z9.73?i=timaru-2022-2023-0.1m) • [NZ Imagery - Registry of Open Data on AWS](https://registry.opendata.aws/nz-imagery/) Index tiles for this dataset are available as layer [Timaru 0.075m Urban Aerial Photos Index Tiles (2022-2023)](http://data.linz.govt.nz/layer/115075)
-
This dataset represents the volcanoes present at or near the surface and comprises points with attributes describing the type of feature and its name. The dataset is part of the Geology of the Pukekohe area collection produced by GNS Science. The mapping frame within which the features have been observed is defined as surface geology (i.e. the bedrock and superficial deposits that are exposed at the topographic surface or would be visible if the overlying soil was removed). The data structure complies with the GeoSciML 4.1 standard, where relevant, and uses the appropriate CGI Controlled Vocabularies. This dataset forms part of Bland KJ, Townsend DB, Hill MP, Jones KE (compilers). 2023. Geology of the Pukekohe area [digital data]. Lower Hutt (NZ): GNS Science. (GNS Science geological map; 12b). For more information on data, distribution options and formats visit https://doi.org/10.21420/ZB5N-HB42. Additional products associated with this dataset are available from https://doi.org/10.21420/Y3CC-PB81.
-
This layer contains the Index Tiles covering Tauranga and McLaren Falls in the Bay of Plenty, captured in December 2022. - The DEM is available as layer [Tauranga LiDAR 1m DEM (2022)](https://data.linz.govt.nz/layer/116086) - The LAS point cloud and vendor project reports are available as layer [Tauranga LiDAR Point Cloud (2022)](https://data.linz.govt.nz/layer/d3SBQrvFZRKBSJX/tauranga-lidar-point-cloud-2022) LiDAR was captured for BOPLASS Ltd by Woolpert NZ Ltd (formerly AAM NZ Ltd) on 2 to 3 December 2022. The dataset was generated by Woolpert and their subcontractors. Data management and distribution is by Toitū Te Whenua Land Information New Zealand. There is no DSM available for this dataset. Data comprises: - DEM: tif or asc tiles in NZTM2000 projection, tiled into a 1:1,000 tile layout - Point cloud: las tiles in NZTM2000 projection, tiled into a 1:1,000 tile layout Pulse density specification is at a minimum of >8 pulses/square metre. Vertical Accuracy Specification is +/- 0.1m (95%) Horizontal Accuracy Specification is +/- 0.3m (95%) Vertical datum is NZVD2016.
-
This layer contains the DSM for LiDAR data in the Tasman Region over Motueka, Moutere and Waimea captured between 14 October 2022 and 7 November 2022. - The DEM is available as layer [Tasman - Tasman Bay LiDAR 1m DEM (2022)](https://data.linz.govt.nz/layer/112583). - The Index Tiles are available as layer [Tasman - Tasman Bay LiDAR Index Tiles (2022)](https://data.linz.govt.nz/layer/112582). - The LAS point cloud and vendor project reports are available from [OpenTopography](https://portal.opentopography.org/datasets?loc=New%20Zealand). LiDAR was captured for Tasman District Council by Aerial Surveys between 14 October 2022 and 7 November 2022. These datasets were generated by Aerial Surveys and their subcontractors. Data management and distribution is by Land Information New Zealand. Data comprises: - DEM: tif or asc tiles in NZTM2000 projection, tiled into a 1:1,000 tile layout - DSM: tif or asc tiles in NZTM2000 projection, tiled into a 1:1,000 tile layout - Point cloud: las tiles in NZTM2000 projection, tiled into a 1:1,000 tile layout Pulse density specification is at a minimum of 4 pulses/square metre. Vertical Accuracy Specification is +/- 0.2m (95%) Horizontal Accuracy Specification is +/- 1.0m (95%) Vertical datum is NZVD2016.
-
Index Tiles ONLY, for actual orthophotos see layer [Marlborough 0.25m Rural Aerial Photos (2021-2022)](http://data.linz.govt.nz/layer/110135) Orthophotography within the Marlborough Region captured in the flying season of 2021-2022. Coverage encompasses approximately 8,210 sq km of imagery within the Marlborough District. Imagery was captured for Marlborough District Council by Aerial Surveys Ltd, Unit A1, 8 Saturn Place, Albany 0632, New Zealand. Data comprises: • 5939 ortho-rectified RGB GeoTIFF images in NZTM projection, tiled into the LINZ Standard 1:2000 tile layout • Tile layout in NZTM projection containing relevant information. The supplied imagery is in terms of New Zealand Transverse Mercator (NZTM) map projection. Please refer to the tile index layer for specific details, naming conventions, etc. Imagery supplied as 25cm pixel resolution (0.25m GSD), 3-band (RGB) uncompressed GeoTIFF. The final spatial accuracy is ±0.4 at 95% confidence level in clear flat areas.
-
This layer contains the DEM for LiDAR data covering Tauranga and McLaren Falls in the Bay of Plenty, captured in December 2022. - The index tiles are available as layer [Tauranga LiDAR Index Tiles (2022)](https://data.linz.govt.nz/layer/116085) - The LAS point cloud and vendor project reports are available as layer [Tauranga LiDAR Point Cloud (2022)](https://data.linz.govt.nz/layer/d3SBQrvFZRKBSJX/tauranga-lidar-point-cloud-2022) LiDAR was captured for BOPLASS Ltd by Woolpert NZ Ltd (formerly AAM NZ Ltd), on 2 to 3 December 2022. The dataset was generated by Woolpert and their subcontractors. Data management and distribution is by Toitū Te Whenua Land Information New Zealand. There is no DSM available for this dataset. Data comprises: - DEM: tif or asc tiles in NZTM2000 projection, tiled into a 1:1,000 tile layout - Point cloud: las tiles in NZTM2000 projection, tiled into a 1:1,000 tile layout Pulse density specification is at a minimum of >8 pulses/square metre. Vertical Accuracy Specification is +/- 0.1m (95%) Horizontal Accuracy Specification is +/- 0.3m (95%) Vertical datum is NZVD2016.
-
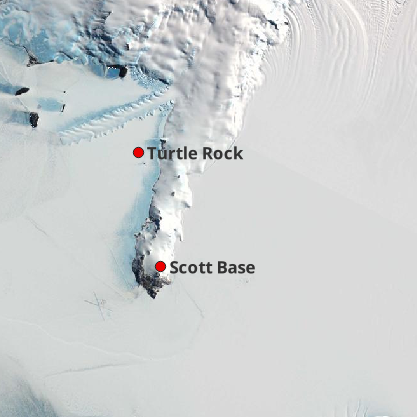
PAR (Oddesey) and temperature sensors (Hobo) were deployed in the ice under red, green, and blue acrylic sheets to examine the response of rhodopsin-bearing cells to environmental stress. Sensors were placed near the top, middle and bottom of the sea ice and left in place for 2 weeks. GET DATA: ken.ryan@vuw.ac.nz
-

Low-frequency radar profiling in a grid around Kamb Ice Stream 2 borehole (-82.47040333, -152.29192167) measuring ice thickness and extrapolating between ApRES observations. These data provide boundary conditions and revealing controlling processes (ice-substrate interactions). GET DATA: christian.ohneiser@otago.ac.nz