 GeoData.NZ
location
Type of resources
Available actions
Topics
Keywords
Contact for the resource
Provided by
Years
Formats
Representation types
Update frequencies
status
Scale
Resolution
-
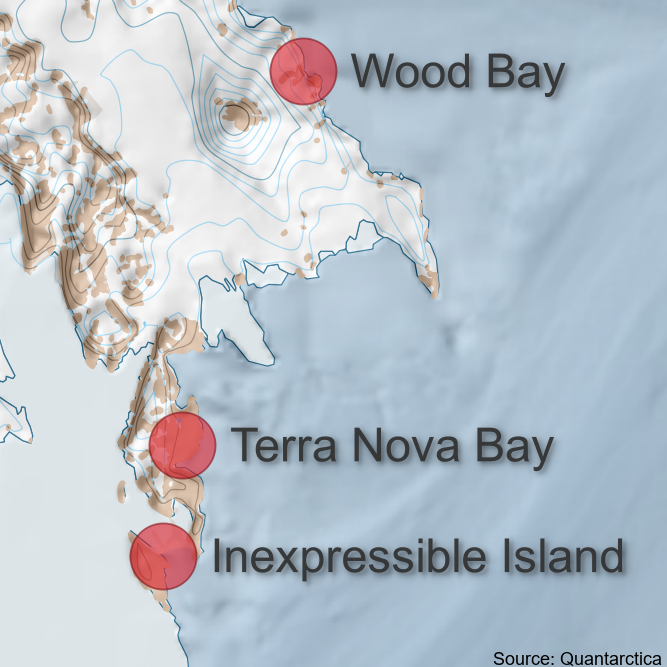
The Antarctica New Zealand Adelie Penguin Census Survey takes aerial images with a helicopter of known penguin colonies on Ross Island and across the Victoria Land coastline. These files provide 36 adelie colony locations. The KML and GeoPackage files both include the same 36 colony locations. Note: colony coordinates are missing for Chinstrap Island, Franklin Island East, and Thala Island. Geopackage and KML files were created in QGIS, and the coordinates were later used to create the GeoPDF files which were used for helicopter navigation to the Adelie penguin colonies.
-
The Moturiki 1953 to NZVD2016 Conversion Raster provides users with a two arc-minute (approximately 3.6 kilometres) raster image of the conversion of normal-orthometric heights from the Moturiki 1953 local vertical datum to the New Zealand Vertical Datum 2016 (NZVD2016). The conversion value is represented by the attribute “O”, in metres. This conversion and NZVD2016 are formally defined in the LINZ standard [LINZS25009](http://www.linz.govt.nz/regulatory/25009). The height conversion grid models the difference between the Moturiki 1953 vertical datum and NZVD2016 using the LINZ GPS-levelling marks. From the GPS-levelling marks the expected accuracy is better than 2 centimetres (95% Confidence interval). More information on converting heights between vertical datums can be found [on the LINZ website](http://www.linz.govt.nz/data/geodetic-services/coordinate-conversion/converting-between-nzvd2016-nzgd2000-and-local-vertical-datums).
-
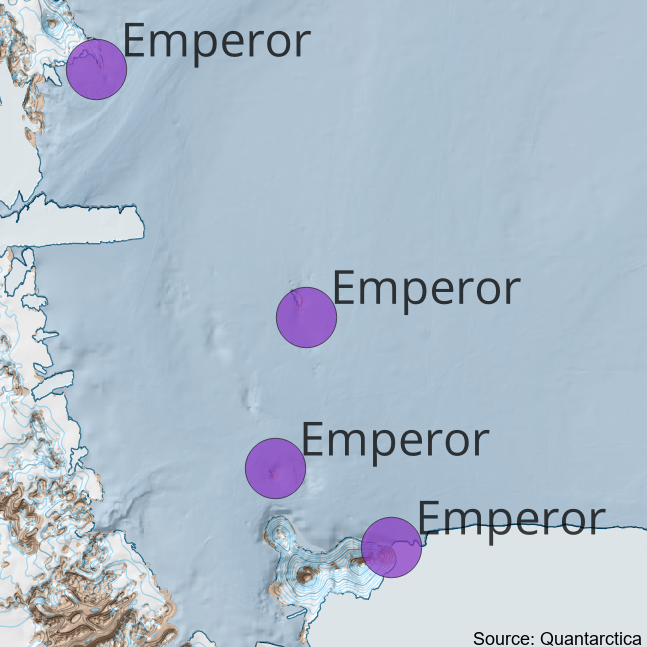
The Antarctica New Zealand Adelie Penguin Census Survey opportunistically took aerial images with a helicopter of known Emperor colonies on Ross Island and across the Victoria Land coastline. These files provide the locations of the colonies surveyed in the 2023/24 season. Geopackage and KML files were created in QGIS, and the coordinates were later used to create the GeoPDF files which were used for helicopter navigation to the colonies.
-
The NSN55-NZGD2000 grid enables the conversion of normal-orthometric heights from the Nelson 1955 local vertical datum directly to New Zealand Geodetic Datum 2000 (NZGD2000) ellipsoidal heights. NSN55-NZGD2000 is published on a one arc-minute grid (approximately 1.8 kilometres) extending over the benchmarks that nominally define the extent of the Nelson 1955 vertical datum (171.3° E to 174.4° E, 40.4° S to 42.7° S). The conversion value is represented by the attribute “delta”, in metres. This grid is a combination of New Zealand Quasigeoid 2016 [NZGeoid2016](https://data.linz.govt.nz/layer/3418) and the [NSN55-NZVD2016](https://data.linz.govt.nz/layer/3438) height conversion grid. Where NZGeoid2016 is the reference surface for the New Zealand Vertical Datum 2016 (NZVD2016), while the NSN55-NZVD2016 grid models the difference between the Nelson 1955 vertical datum and NZVD2016 using the LINZ GPS-levelling marks. More information on converting heights between vertical datums can be found [on the LINZ website](http://www.linz.govt.nz/data/geodetic-services/coordinate-conversion/converting-between-nzvd2016-nzgd2000-and-local-vertical-datums).
-
Coordinates computed from surveys undertaken after the 14 February 2016 Canterbury earthquake. These should be consistent with any observations made after this earthquake (neglecting any localised deformation such as that due to liquefaction). **For further information about this dataset, see [the Canterbury earthquake information](http://www.linz.govt.nz/land/surveying/canterbury-earthquakes/geodetic-survey-control-network).** These coordinates are only provisional. Analysis is ongoing as further data is collected. Coordinates were calculated using SNAP v2.5.33. Stations were constrained using coordinates of distant PositioNZ continuous GNSS stations that were unaffected by the earthquake. The standard deviations of coordinates are 0.01m horizontally and 0.02m vertically, relative to the PositioNZ network. Coordinate changes due to the earthquake have been calculated by comparing pre and post-earthquake coordinates. Pre-earthquake coordinates were calculated relative to public and private continuous GNSS stations. These continuous GNSS stations had data processed for several days early in 2016 (before the earthquake). Other pre-earthquake geodetic data was then readjusted with the continuous GNSS data. Note that this means these coordinate changes may differ slightly from those that would be calculated by comparing the post-earthquake coordinates with those currently in the Geodetic Database. These coordinates are suitable for use in surveys and other geospatial activities in Canterbury and Christchurch.
-
The GSB26-NZVD2016 grid enables the conversion of normal-orthometric heights from the Gisborne 1926 local vertical datum to the New Zealand Vertical Datum 2016 (NZVD2016). The conversion value is represented by the attribute “O”, in metres. This conversion and NZVD2016 are formally defined in the LINZ standard [LINZS25009](http://www.linz.govt.nz/regulatory/25009). GSB26-NZVD2016 is published on a two arc-minute grid (approximately 3.6 kilometres) extending over the benchmarks that nominally define the extent of the Gisborne 1926 vertical datum (177.0° E to 178.6° E, 37.4° S to 39.0° S). The height conversion grid models the difference between the Gisborne 1926 vertical datum and NZVD2016 using the LINZ GPS-levelling marks. From the GPS-levelling marks the expected accuracy of GSB26-NZVD2016 is better than 2 centimetres (95% Confidence interval). More information on converting heights between vertical datums can be found [on the LINZ website](http://www.linz.govt.nz/data/geodetic-services/coordinate-conversion/converting-between-nzvd2016-nzgd2000-and-local-vertical-datums).
-
The MOT53-NZGD2000 grid enables the conversion of normal-orthometric heights from the Moturiki 1953 local vertical datum directly to New Zealand Geodetic Datum 2000 (NZGD2000) ellipsoidal heights. MOT53-NZGD2000 is published on a one arc-minute grid (approximately 1.8 kilometres) extending over the benchmarks that nominally define the extent of the Moturiki 1953 vertical datum (174.5° E to 178.26° E, 36.5° S to 40.7° S). The conversion value is represented by the attribute “delta”, in metres. This grid is a combination of New Zealand Quasigeoid 2016 [NZGeoid2016](https://data.linz.govt.nz/layer/3418) and the [MOT53-NZVD2016](https://data.linz.govt.nz/layer/3434) height conversion grid. Where NZGeoid2016 is the reference surface for the New Zealand Vertical Datum 2016 (NZVD2016), while the MOT53-NZVD2016 grid models the difference between the Moturiki 1953 vertical datum and NZVD2016 using the LINZ GPS-levelling marks. More information on converting heights between vertical datums can be found [on the LINZ website](http://www.linz.govt.nz/data/geodetic-services/coordinate-conversion/converting-between-nzvd2016-nzgd2000-and-local-vertical-datums).
-
The AUK46-NZVD2016 grid enables the conversion of normal-orthometric heights from the Auckland 1946 local vertical datum to the New Zealand Vertical Datum 2016 (NZVD2016). The conversion value is represented by the attribute “O”, in metres. This conversion and NZVD2016 are formally defined in the LINZ standard [LINZS25009](http://www.linz.govt.nz/regulatory/25009). AUK46-NZVD2016 is published on a two arc-minute grid (approximately 3.6 kilometres) extending over the benchmarks that nominally define the extent of the Auckland 1946 vertical datum (174.0° E to 176.2° E, 36.1° S to 38.0° S). The height conversion grid models the difference between the Auckland 1946 vertical datum and NZVD2016 using the LINZ GPS-levelling marks. From the GPS-levelling marks the expected accuracy of AUK46-NZVD2016 is better than 2 centimetres (95% Confidence interval). More information on converting heights between vertical datums can be found [on the LINZ website](http://www.linz.govt.nz/data/geodetic-services/coordinate-conversion/converting-between-nzvd2016-nzgd2000-and-local-vertical-datums).
-
The Canterbury region of New Zealand experienced a sequence of significant earthquakes during 2010 and 2011. These earthquakes occurred on 2010-09-04, 2011-02-22, 2011-06-13 and 2011-12-23. This layer contains coordinates computed from GNSS fast static and network RTK surveys undertaken after the Canterbury earthquakes. It also includes Lyttelton Vertical Datum 1937 and Christchurch Drainage Datum heights, derived from the GNSS data. **Users may also be interested in the simplified data in the companion layer [Canterbury Earthquake Geodetic Marks (2010, 2011) - Simple](http://data.linz.govt.nz/layer/1589).** These coordinates are only provisional. Analysis is ongoing as further data is collected. Coordinates were calculated using SNAP v2.3.61. Stations were constrained using coordinates calculated by GNS Science. Some coordinates were calculated from data provided by Christchurch City Council and other public and private organisations. No precise levelling data has been used. The uncertainty (one standard deviation) is 0.02m horizontally, and 0.03m vertically for NZGD2000 ellipsoidal heights. The uncertainty (one standard deviation) of the Lyttelton Vertical Datum 1937 and Christchurch Drainage Datum heights is 0.05m. The coordinates calculated prior to 2010-09-04 have been calculated from a combined adjustment including LINZ data and additional data provided by public and private organisations. These coordinates differ from those in the Geodetic Database and more accurately reflect the position of the mark immediately prior to the 2010-09-04 earthquake. The deformation model igns2011_working.grd calculated from a model (v4) provided by GNS Science on 28 April 2011 was used to remove secular deformation. Lyttelton Vertical Datum 1937 heights have been computed from NZGD2000 ellipsoidal heights by subtracting NZGeoid2009 geoid heights and adding an offset of 0.47m to bring in terms of Lyttelton Vertical Datum 1937. Christchurch Drainage Datum (CDD) heights have been computed in the Christchurch area from NZGD2000 ellipsoidal heights by subtracting NZGeoid2009 geoid heights and adding an offset of 0.523m (specifically calculated for Christchurch City) to bring in terms of Lyttelton Vertical Datum 1937 (for Christchurch) and a further offset of 9.04m to bring in terms of CDD. The model used to estimate whether movements greater than 2cm occurred at a mark (excluding those due to liquefaction or other localised deformation) after the 2010-09-04 earthquake was provided by GNS Science (Darfield_Sep2010_model_8.5_grid_displacements_calcs.xls). The model used to estimate whether movements greater than 2cm occurred at a mark (excluding those due to liquefaction or other localised deformation) after the 2011-02-22 earthquake was provided by GNS Science (Chch_Feb2011_geodetic_source_model_3.21.xls). The model used to estimate whether movements greater than 2cm occurred at a mark (excluding those due to liquefaction or other localised deformation) after the 2011-06-13 earthquake was provided by GNS Science (Chch_Jun2011_geodetic_source_model_0.4.xls). The model used to estimate whether movements greater than 2cm occurred at a mark (excluding those due to liquefaction or other localised deformation) after the 2011-12-23 earthquake was provided by GNS Science (Chch_Dec2011_geodetic_source_model_0.2.xls). These coordinates are suitable for use in surveys and other geospatial activities in Canterbury and Christchurch. **For full information about this dataset, see [the Canterbury earthquake information](http://www.linz.govt.nz/survey-titles/canterbury-earthquake/canterbury-earthquake/geodetic-survey-control-coordinates) on the LINZ website.**
-
The WGN53-NZVD2016 grid enables the conversion of normal-orthometric heights from the Wellington 1953 local vertical datum to the New Zealand Vertical Datum 2016 (NZVD2016). The conversion value is represented by the attribute “O”, in metres. This conversion and NZVD2016 are formally defined in the LINZ standard [LINZS25009](http://www.linz.govt.nz/regulatory/25009). WGN53-NZVD2016 is published on a two arc-minute grid (approximately 3.6 kilometres) extending over the benchmarks that nominally define the extent of the Wellington 1953 vertical datum (174.4° E to 176.4° E, 39.1° S to 41.6° S). The height conversion grid models the difference between the Wellington 1953 vertical datum and NZVD2016 using the LINZ GPS-levelling marks. From the GPS-levelling marks the expected accuracy of WGN53-NZVD2016 is better than 2 centimetres (95% Confidence interval). More information on converting heights between vertical datums can be found [on the LINZ website](http://www.linz.govt.nz/data/geodetic-services/coordinate-conversion/converting-between-nzvd2016-nzgd2000-and-local-vertical-datums).