 GeoData.NZ
ROSS ISLAND
Type of resources
Available actions
Topics
Keywords
Contact for the resource
Provided by
Years
Update frequencies
status
Scale
-
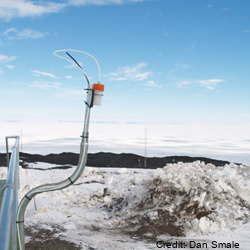
Ultraviolet radiation measurements over the spectral region 290-450 nm with a high precision spectro-radiometer. The spectro-radiometer was installed at Arrival Heights as a two month (November 2006 – January 2007) blind inter-comparison with the established measurement programme run by Biospherical Instruments for the USAP. The data was compared with the USAP data taken simultaneously. These data are held internally by NIWA. GET DATA: contact dan.smale@niwa.co.nz
-
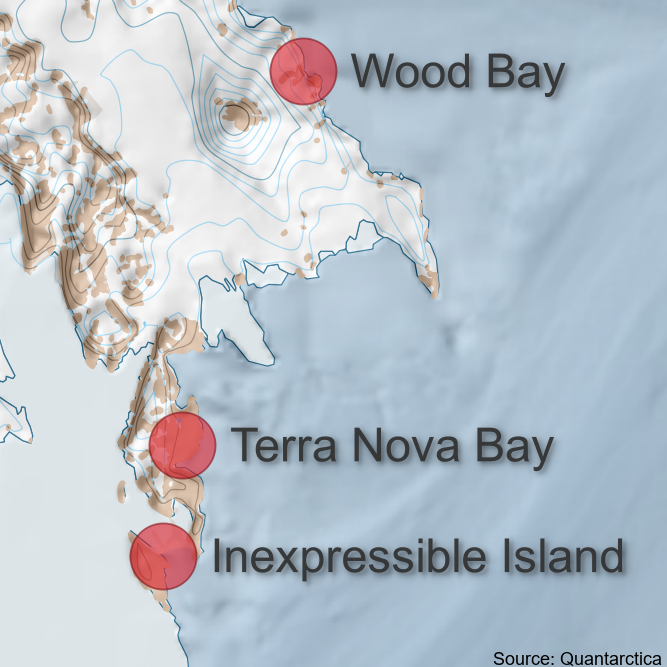
The Antarctica New Zealand Adelie Penguin Census Survey takes aerial images with a helicopter of known penguin colonies on Ross Island and across the Victoria Land coastline. These files provide 36 adelie colony locations. The KML and GeoPackage files both include the same 36 colony locations. Note: colony coordinates are missing for Chinstrap Island, Franklin Island East, and Thala Island. Geopackage and KML files were created in QGIS, and the coordinates were later used to create the GeoPDF files which were used for helicopter navigation to the Adelie penguin colonies.
-
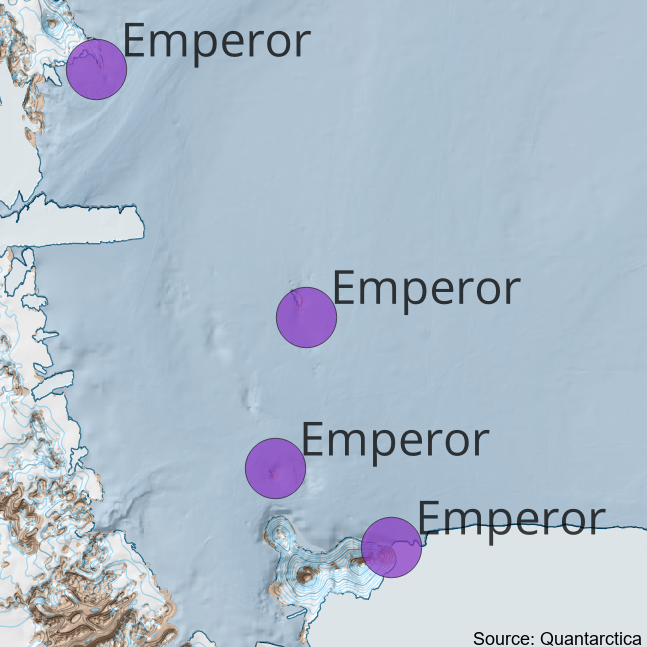
The Antarctica New Zealand Adelie Penguin Census Survey opportunistically took aerial images with a helicopter of known Emperor colonies on Ross Island and across the Victoria Land coastline. These files provide the locations of the colonies surveyed in the 2023/24 season. Geopackage and KML files were created in QGIS, and the coordinates were later used to create the GeoPDF files which were used for helicopter navigation to the colonies.
-
Measurements of chlorine monoxide (ClO) made with a Microwave Chlorine Monoxide Millimeter Wave Spectrometer (ground-based). The instrument (ClOe1) was established in January of 1996 at Scott Base and decommissioned in October 2023. A replacement radiometer (ClOe4) was installed at Scott Base in February 2023 (an overlap in the data for timeseries continuity purposes). These data are produced in collaboration with State University of New York (SUNY) Stoney Brook and Naval Research Laboratory (NRL). “Raw” data are times and recorded microwave emission spectra. “Derived” data are column amounts and vertical profile information of chlorine monoxide (ClO). The instrument has acquired the nickname "CloeTechnique" for vertical profile information uses "optimal estimation" to extract information from pressure broadening of ClO emission line. Significant failure in early 2018 only fixed in November 2018. No data in the July - October 2018 period. Data is held at NRL and in the NDACC database. Data are available as monthly .ndm files, and additional metadata are available in the header. Instrument coordinates (-77.85, 166.77). Instrument timeline: - ClOe1 1996-2023 - ClOe4 2023 – present GET DATA: https://www-air.larc.nasa.gov/missions/ndacc/data.html?station=scott.base#
-
Measurements of boundary layer concentration of ozone are made with insitu instruments that samples air continuously at Arrival Heights, Antarctica and is part of the NOAA Global Monitoring Surface Ozone Network. Original measurements at Arrival Heights were made with a Dasibi Environmental Corp in situ analyser. This was replaced with a TEI-49c in situ analyser. The TEI-49c is owned by NOAA and operated by NIWA at Arrival Heights until October 2023. In October 2023 operation of the TEI was transferred to the USAP Arrival Heights laboratory along with operational responsibility (between NOAA and USAP). This data set contains continuous UV photometric data of surface level ozone collected at 6m above ground level. Data records consist of UTC time, date, and processed ozone mixing ratio (parts per billion). Data is collected from global locations and is provided in 1 minute and 1 hour averages. Data are archived at the NOAA National Climatic Data Center (NCDC), but are produced and available from NOAA Earth System Research Laboratory (ESRL). Instrument timeline: - Dasibi 1997-2003 - TEI49c 2003 – October 2023 - TEI49i November 2023 -present at USAP Arrival Heights laboratory GET DATA: https://gml.noaa.gov/aftp/data/ozwv/SurfaceOzone/ARH/
-
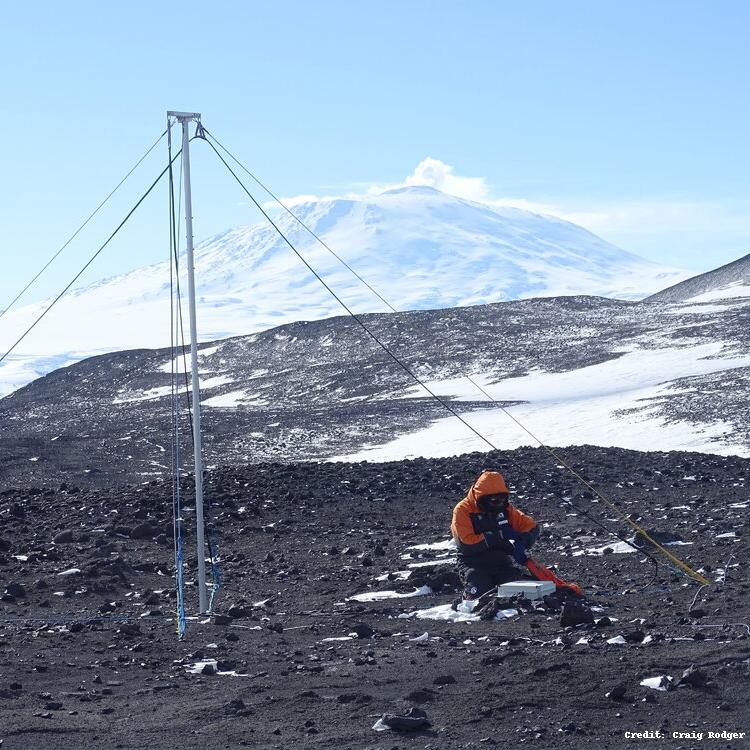
The WWLLN Very Low Frequency (VLF) Radio Sensor was installed at Scott Base in November 2015 by Dr. James Brundell and Ms. Emma Douma as part of Antarctica New Zealand Event K060-1516-A. The sensor measures the electric field in the Very Low Frequency radio range (~500 Hz-50 kHz) and passes it to a PC which processes the data for the experiments. The antenna is located behind the Hatherton lab. It was installed due to increasing manmade electromagnetic noise levels in the "quiet zone" at Arrival Heights. The observations from this antenna are now the primary WWLLN feed from Ross Island, the Arrival Height's magnetic field antenna is now a backup. WWLLN, uses the VLF feed but processes it to detect the radio-wave pulses from lightning. WWLLN observations are sent to a central processing computer to determine the time and location of lightning pulses all over the globe. The World Wide Lightning Location Network (WWLLN) is an experimental Very Low Frequency (VLF) network of sensors being developed through collaborations with research institutions across the globe. The network exploits the considerable electromagnetic power radiated by lightning as "sferics" present in the VLF band. By combining radio-pulse observations from at least 5 stations, the WWLLN central processing computers can determine the location of the original lightning discharge. As the radio-pulse observations are immediately sent back across the internet to the central processing computers locations are generated within ~10 s of the discharge, and thus near real time. There are currently about 70 active VLF receiving stations operating in the VLF World-Wide Lightning Location Network, including the Scott Base measurements. WWLLN observations are continuously transmitted to one of the WWLLN primary servers, in this case flash.ess.washington.edu at the University of Washington, Seattle, USA. GET DATA: https://space.physics.otago.ac.nz/aarddvark/
-
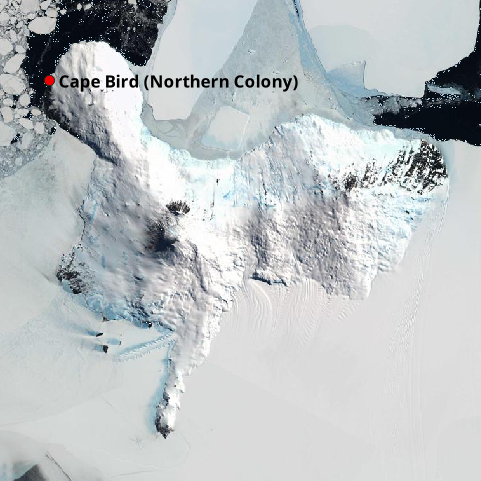
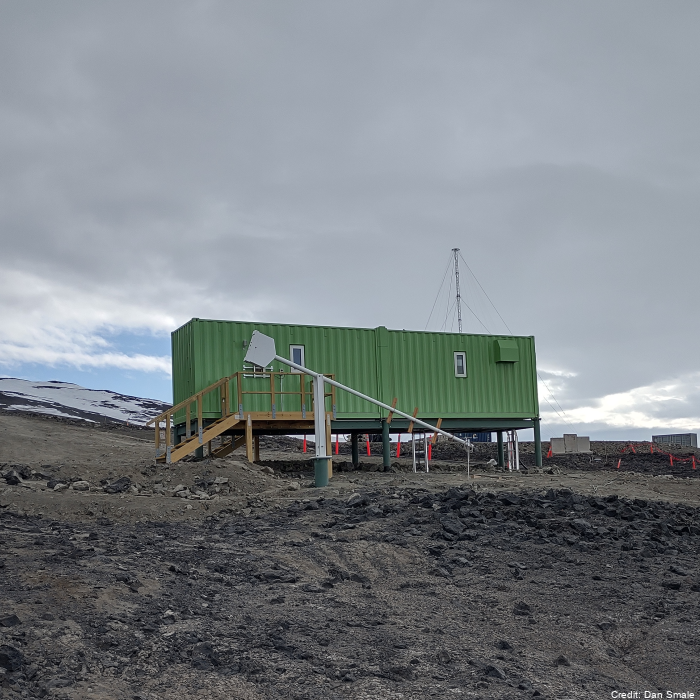
An automated weather station was installed to measure local scale weather conditions in the vicinity of the colony meltwater stream at Cape Bird's northern colony. The AWS had a RM Young anemometer, Apogee shortwave and longwave radiometer, also measured air temperature at 2 m, relative humidity, and had three thermocouples that measured soil temperature at the surface, 2 cm and 5 cm depth. Data was collected at 5 second intervals averaged to 10 minute averages. GET DATA: tanya.oneill@waikato.ac.nz
-
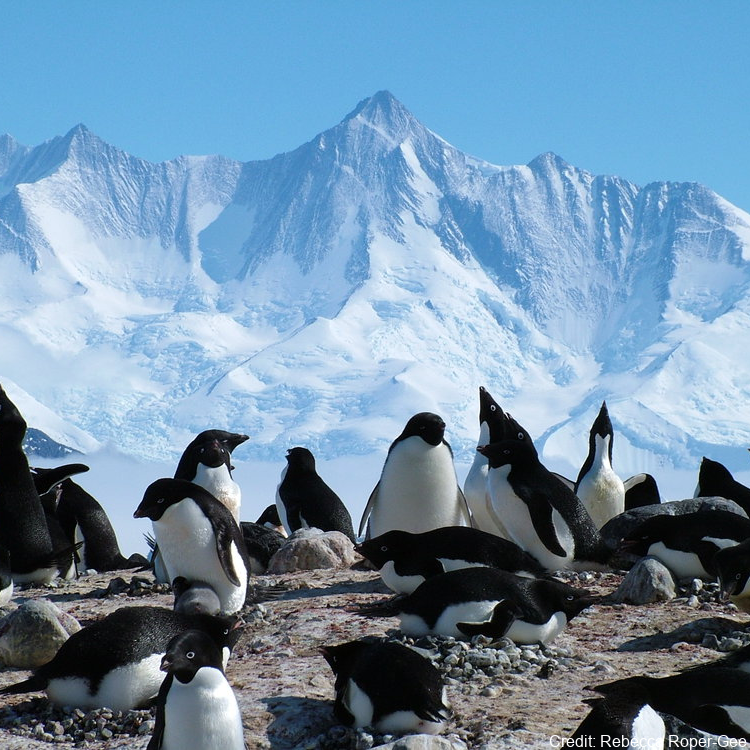
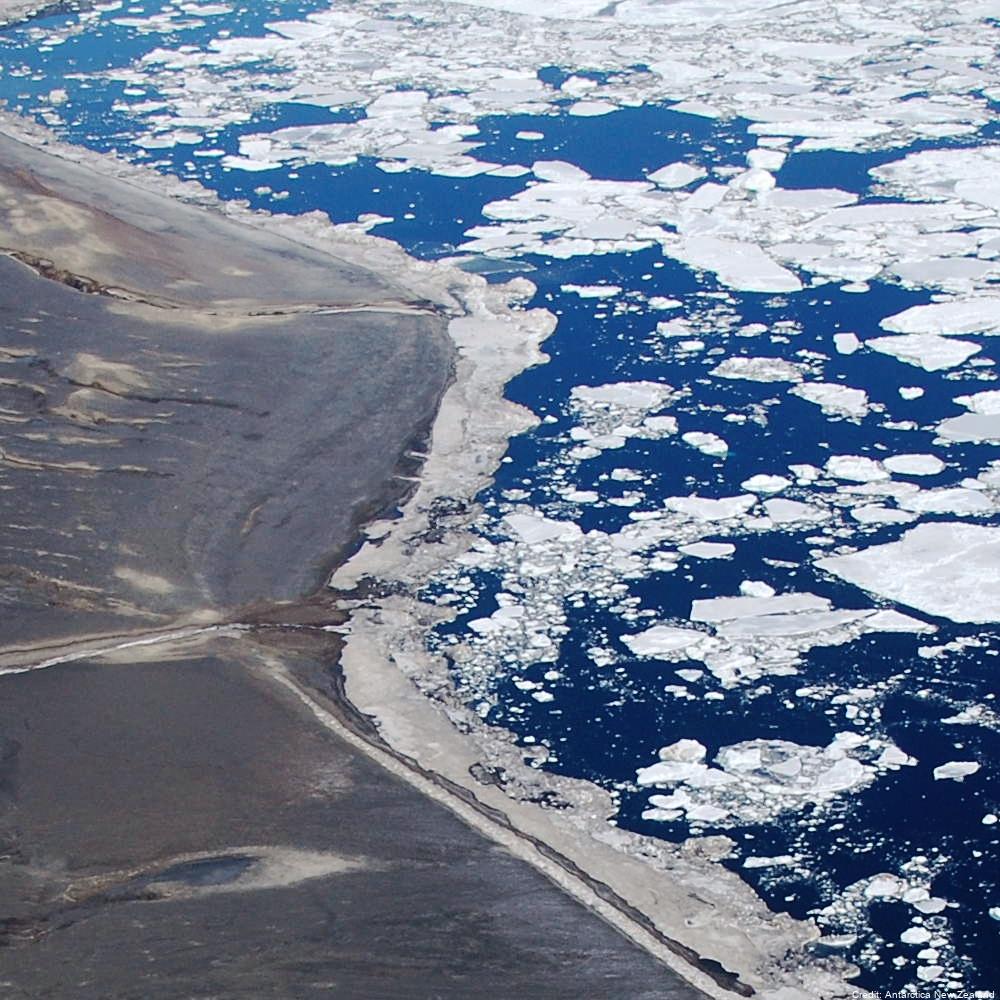
Polar regions are experiencing some of the most dramatic effects of climate change resulting in large-scale changes in sea ice cover. Despite this, there are relatively few long-term studies on polar species that evaluate the full scope of these effects. Over the last two decades, this team has conducted globally unique demographic studies of Adélie penguins in the Ross Sea, Antarctica, to explore several potential mechanisms for population change. This five-year project will use penguin-borne sensors to evaluate foraging conditions and behavior and environmental conditions on early life stages of Adélie penguins. Results will help to better understand population dynamics and how populations might respond to future environmental change. To promote STEM literacy, education and public outreach efforts will include multiple activities. The PenguinCam and PenguinScience.com website (impacts of >1 million hits per month and use by >300 classrooms/~10,000 students) will be continued. Each field season will also have ‘Live From the Penguins’ Skype calls to classes (~120/season). Classroom-ready activities that are aligned with Next Generation Science Standards will be developed with media products and science journal papers translated to grade 5-8 literacy level. The project will also train early career scientists, postdoctoral scholars, graduate students and post-graduate interns. Finally, in partnership with an Environmental Leadership Program, the team will host 2-year Roger Arliner Young Conservation Fellow, which is a program designed to increase opportunities for recent college graduates of color to learn about, engage with, and enter the environmental conservation sector. Further details are provided at: Morandini, V., Dugger, K. M., Schmidt, A. E., Varsani, A., Lescroël, A., Ballard, G., Lyver, P. O., Barton, K., & Ainley, D. G. (2024). Sex-specific recruitment rates contribute to male-biased sex ratio in Adélie penguins. Ecology and Evolution, 14, e10859. https://doi.org/10.1002/ece3.10859 GET DATA: https://doi.org/10.15784/601444
-
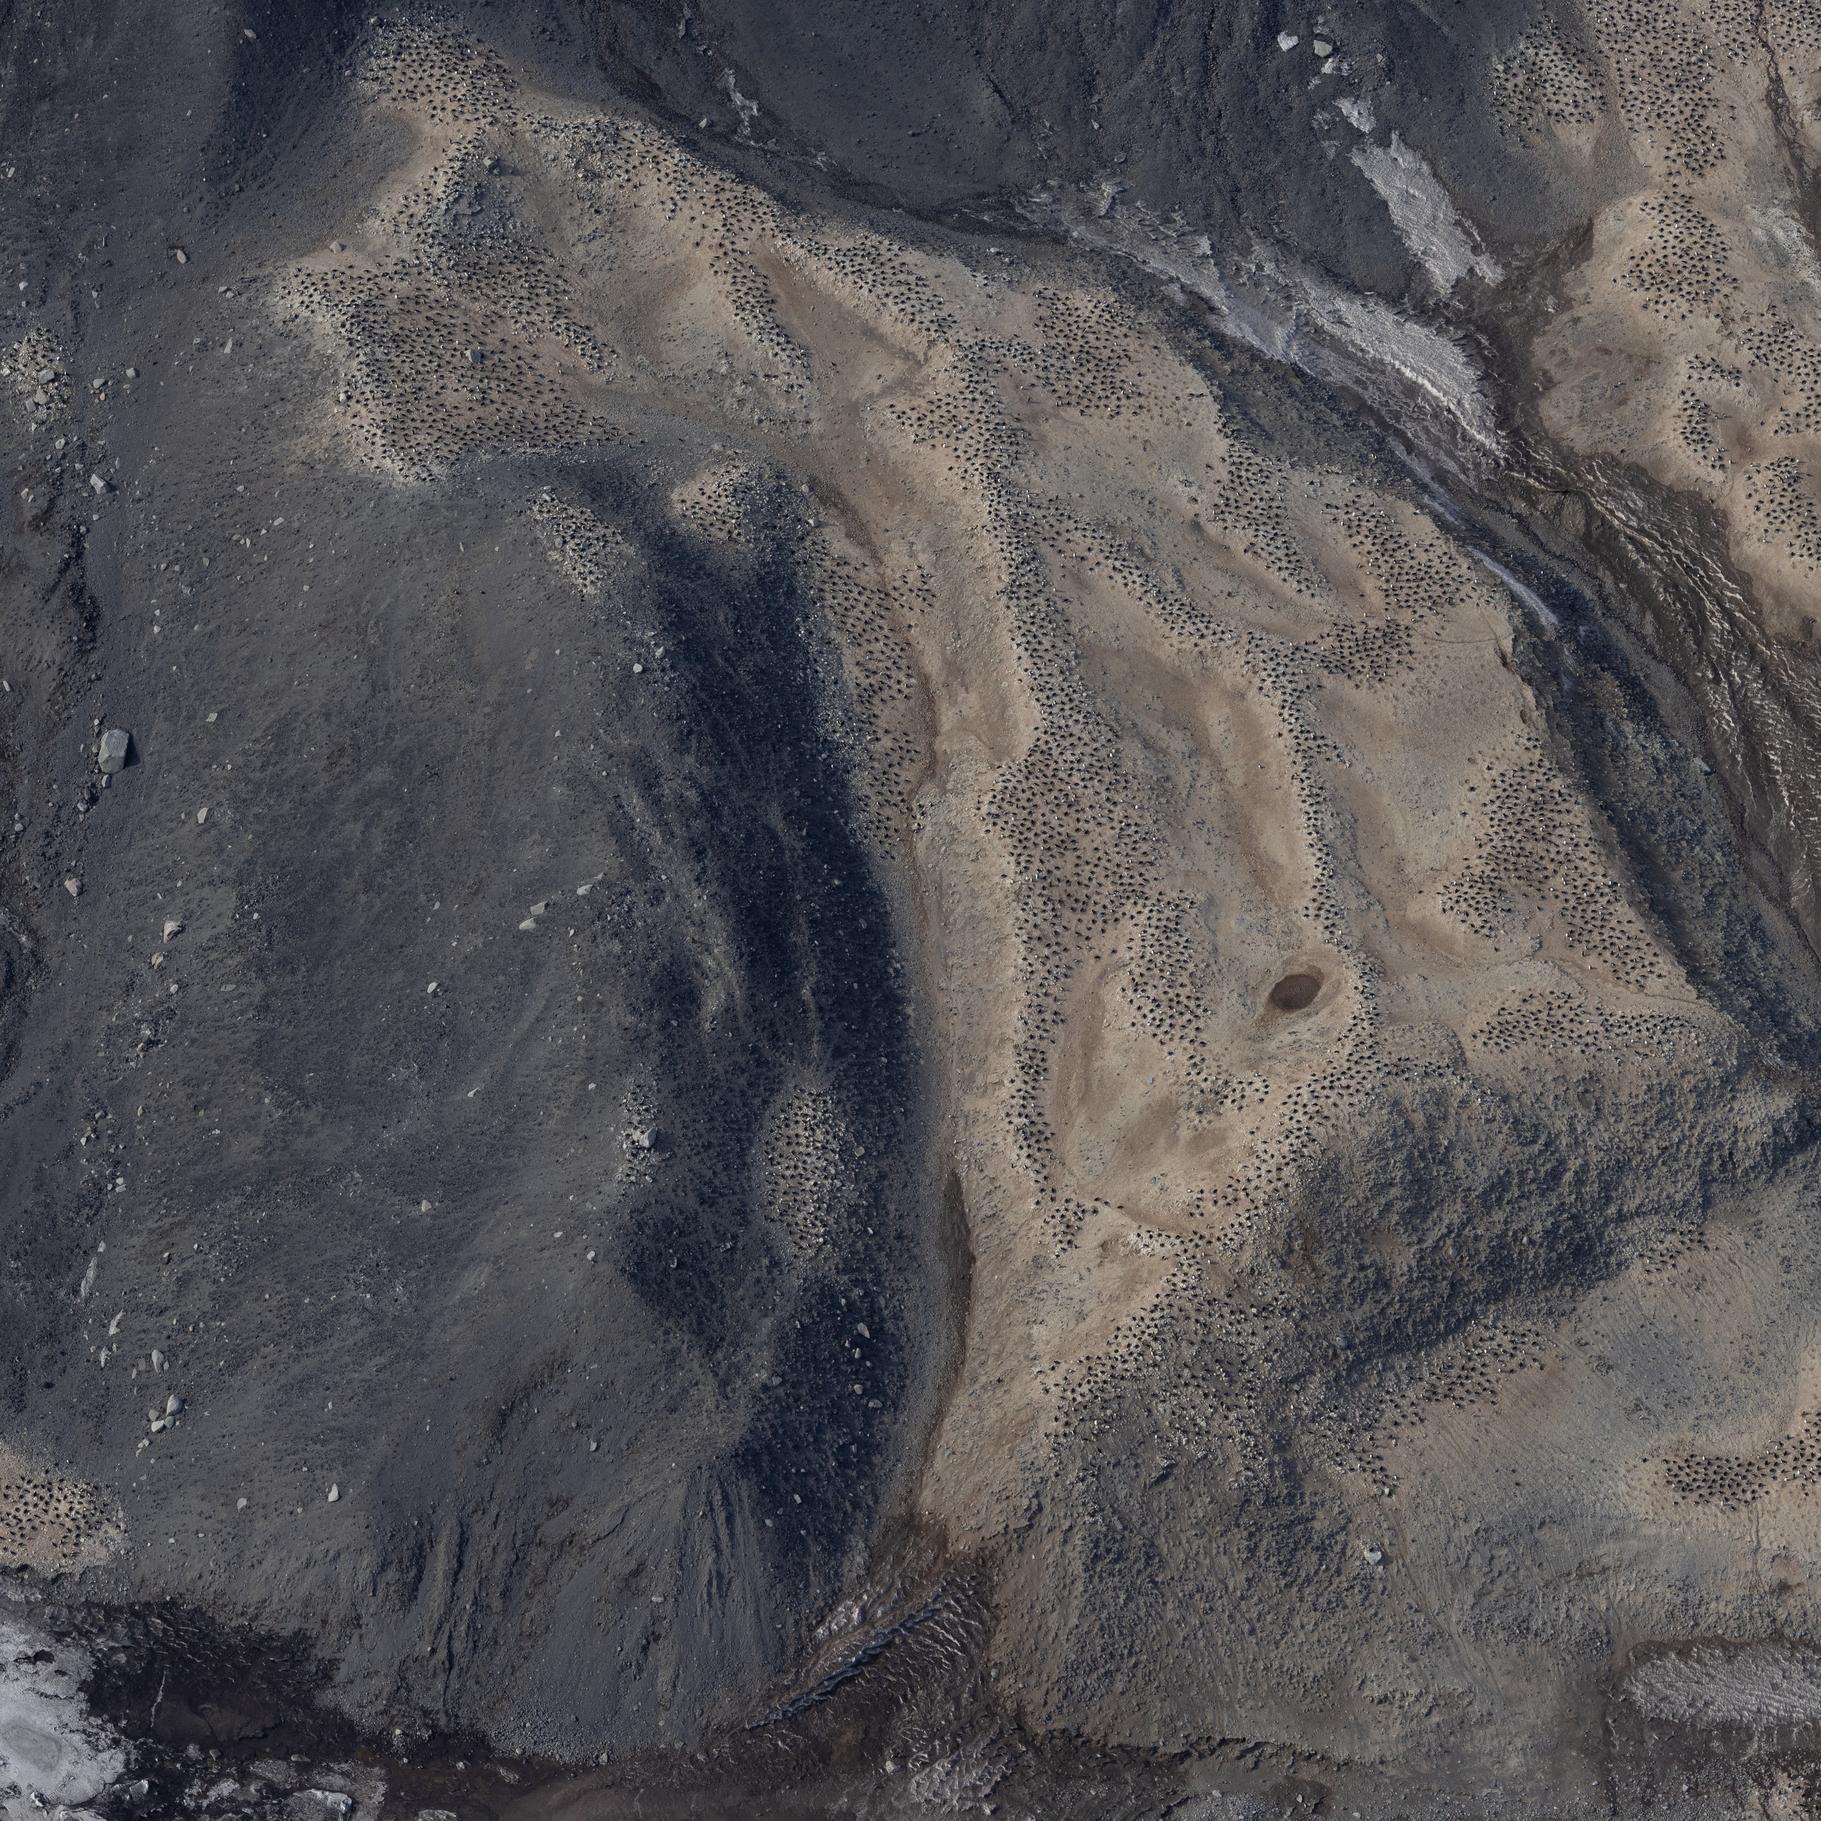
Raw images (over approximately 20.000 unique images) collected during the Adelie Penguin Census across 30+ colonies since 1981 (see associated metadata resource for list full list of colonies). Photographs were taken using a black and white film camera from 1981 to 2004 (inclusive) and 2008. Images are available in .tif fomrat. Images are digital from 2005 onwards (except 2008). Raw images are available in cr2/cr3 formats, and processed images are available across tif and jpg formats. High resolution scanning was initiated in 2011 to scan all the negatives in the collection. There are approximately 10,000 negatives in the collection. Images are taken from helicopter at between 2000-2500 feet. All images collected during the 2324 season are georeferenced with latitude and longitude positions in decimal degrees (WGS 84). Camera Settings: ISO = 400 Shutter speed = greater than 1/1000 Focus = manual, pre-focus to 800m Lens = 135mm with UV filter Aperture/ Exposure = F8 (or up to F11) Image Size = Full size White Balance Setting = Daylight Captures per minute = ~80 GET DATA: m.meredyth-young@antarcticanz.govt.nz
-
Aerial reconnaissance and photography are used in the Ross Sea sector of Antarctica to determine the breeding locations of Adélie penguins and to count the numbers of nests occupied during the early incubation period. From 1981 to present (two-year embargo), all islands and sea coasts between 158°E and 175°E have been searched, and 11 previously unreported breeding colonies discovered. The aim is to census Adélie (Pygoscelis adeliae) populations to provide basic data against which future population levels can be compared in order to monitor environmental change of the Antarctic Ocean ecosystem, both natural and man-induced. GET DATA: https://datastore.landcareresearch.co.nz/en_AU/dataset/adelie-penguin-census-data