 GeoData.NZ
National Institute of Water and Atmospheric Research (NIWA)
Type of resources
Available actions
Topics
Keywords
Contact for the resource
Provided by
Years
Formats
Update frequencies
status
Resolution
-

The data set contains water temperature, salinity, and oxygen taken by CTD during three hydrographic sections perpendicular to the slope in the Western Ross Sea between Cape Adare and the Drygalski Trough. Data are in NetCDF. RELATED PUBLICATION: https://doi.org/10.1038/s41598-021-81793-5 GET DATA: https://www.ncei.noaa.gov/archive/accession/0219916
-
Ocean acidification conditions around the New Zealand coast are being measured to establish baseline conditions and to quantify future change. The NZOA-ON is a network of coastal sites around the country – a mix of pristine and urban sites, and sites which are of particular interest to regional councils, the aquaculture and fishing industries, and sites of scientific interest. Data will be used to determine local conditions, and to provide a baseline against which to measure future change. This network is linked into the Global Ocean Acidification Observing Network (GOA-ON The network uses existing data collection infrastructure where possible to take advantage of auxiliary data and historic records. Sampling partners collect fortnightly water samples, liaise regarding shipment and logistics, and assist with deployment of the sensors. Sampling partners collecting the water samples, possibly as part of existing monitoring programmes, have access to the data to help them with their own management strategies. Sampling partners include regional councils, the Department of Conservation, and aquaculture industries. Water samples are taken fortnightly at each site (see Figure 1 for the sampling sites) by the sampling partners, then the full crates are returned to Dunedin for analysis of acidity parameters - alkalinity and total dissolved inorganic carbon (to develop a long-term data series). We then calculate pHT, pCO2, carbonate ion concentration, and saturation states. NIWA provides sampling partners with bottles, crates, chemically resistant gloves and training (including health and safety information). The actual sampling isn’t difficult, however sampling partners are required to use a droplet bottle to add a couple of drops of mercuric chloride (which is toxic) into the full sample bottles, so that the seawater is ‘preserved’ until it gets to the lab. SeaFET pH sensors[2] are deployed for 4-5 months at each site, and are moved from site to site to help determine short term variability at each location. Additional parameters are measured at the Dunedin and Firth of Thames sites, so that these sites meet the extra requirements of the Global Ocean Acidification Observing Network (GOA-ON). The network uses data collection infrastructure where possible to take advantage of auxiliary data and historic records.
-
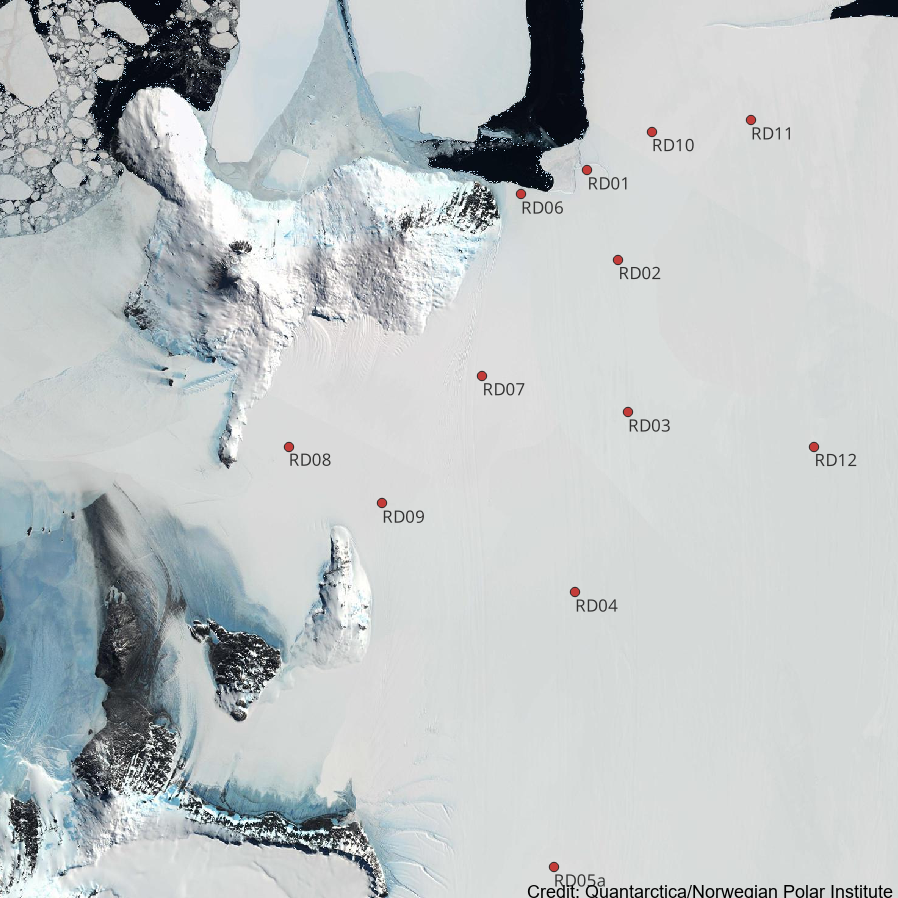
12 ApRES (Autonomous phase-sensitive Radio Echo Sounder) ice-penetrating radars were deployed on the Ross Ice Shelf in 2021/22 to measure basal melting. Each radar measures a profile of the ice shelf, typically at hourly intervals. Changes in the range of the basal and internal reflectors can be used to estimate basal melting. Instruments return a small subset of data in near real time via Iridium SBD telemetry, allowing a crude estimate of melting. Full resolution data is stored the instrument and can only be recovered with site visits. Instruments suffered failures during 2022, so the data sets have significant gaps within 2022/23. Data type: Binary as described in ApRES manual Instrument details are provided at: Nicholls KW, Corr HFJ, Stewart CL, Lok LB, Brennan PV, Vaughan DG. A ground-based radar for measuring vertical strain rates and time-varying basal melt rates in ice sheets and shelves. Journal of Glaciology. 2015;61(230):1079-1087. https://doi.org/10.3189/2015JoG15J073 GET DATA: craig.stewart@niwa.co.nz
-
Ultraviolet radiation measurements over the spectral region 290-450 nm with a high precision spectro-radiometer. The spectro-radiometer was installed at Arrival Heights as a two month (November 2006 – January 2007) blind inter-comparison with the established measurement programme run by Biospherical Instruments for the USAP. The data was compared with the USAP data taken simultaneously. These data are held internally by NIWA. GET DATA: contact dan.smale@niwa.co.nz
-

Using seafloor image data to build single-taxon and community distribution models for seabed fauna in New Zealand waters. Understanding the spatial distributions of seabed biodiversity is essential for effective management of the effects of human activities. However, existing knowledge of seabed faunal distributions comes overwhelmingly from records of museum specimens and fisheries and research trawl bycatch. Data from such sources have been used to build models that predict species and community distributions on the basis of correlations with environmental gradients but because these models are based on presence-only data from disparate sources and times, their predictions are considered uncertain. To improve understanding of seabed fauna distributions around New Zealand, we are developing a new database of occurrences and population densities based entirely on quantitative data from seabed photographic surveys designed to sample these fauna. By modelling the spatial relationships between taxon occurrences and environmental gradients across the region, we are able to predict the likelihood of individual taxa and communities being present in as-yet unsampled areas. In the first phase of the project, we concentrated on Chatham Rise; a region of high importance to commercial fisheries and with the highest density of existing seabed imagery. The models developed here were the first abundance-based models of benthic distributions in the New Zealand region at these spatial scales. In the second phase, we expanded the domain of the predictive models to encompass Campbell Plateau, in the south-eastern sector the EEZ. Combining data from Chatham Rise and Campbell Plateau in a single dataset of benthic invertebrate taxon occurrences and population densities enabled development of up-dated predictive distribution models for a range of individual invertebrate taxa, as well as models of the spatial variability in overall community composition. Rasters are in a geotiff format at a 1000 m resolution cell size and have their relevant projections written in their files.
-

Sand percentage of seafloor sediments from the New Zealand region from nzSEABED database. Data or descriptions of sand content are from the top 10 cm of the seafloor. Sand is defined by its texture/grainsize (all sediment 63μm-2mm) and does not reflect the composition of the seafloor sediment.
-
From 1997 to 2008, a research programme to determine if fish assemblages in the New Zealand region could be classified into clearly identifiable communities based on their associations with each other and with environmental features was undertaken. The programme resulted in the creation of the Fish Communities Database, from which this dataset was extracted. The data set includes records from 1964 to 2008. These data have been used to show geographical and depth distributions of species from all research tows within the New Zealand EEZ since 2008. The main source of data was the Ministry for Primary Industries research trawl database.
-
This dataset is part of the IMOS Underway CO2 Measurements group. This group is a research and data collection project working within the IMOS Ship of Opportunity Multi-Disciplinary Underway Network sub-facility. The CO2 group sample critical regions of the Southern Ocean, Australian and the New Zealand shelf waters, which have a major impact on CO2 uptake by the ocean. These are regions where biogeochemical cycling is predicted to be particularly sensitive to a changing climate. The pCO2 Underway System measures the fugacity of carbon dioxide (fCO2) along with other variables such as sea surface salinity (SSS) and sea surface temperature (SST) using an automated system. The RV Tangaroa provides data on surface ocean CO2 for the oceans adjacent to New Zealand.
-

Geochemical data set comprising of major and trace element analyses of phosphorite nodules from deposits located around offshore New Zealand.
-

This data collection contains observations from moored instruments primarily from New Zealand and Antarctic waters deployed by the National Institute of Water and Atmospheric Research (NIWA) and its predecessor the DSIR. Data was sourced from a range of instrumentation over many decades, with primary measured variables including temperature, pressure, salinity, and current speed/direction. More recently, other chemical and biological variables may be found within data records. Data quality checking is variable but mostly quality controlled to remove bad data using visual checks on records – see individual un-subsetted files for specific information relating to contained data.