 GeoData.NZ
annually
Type of resources
Topics
Keywords
Contact for the resource
Provided by
Years
Formats
Representation types
Update frequencies
status
Scale
Resolution
-

This dataset has been superseded by a new edition (3rd edition, 2020) available here: https://data.gns.cri.nz/metadata/srv/eng/catalog.search#/metadata/5F6780CB-4135-4204-A2C8-50DD74B0466F. This 2nd edition has been kept as a historical archive and is available on request.. This dataset is the structural measurements data for New Zealand. The dataset is a product of the QMAP Geological Map of New Zealand Project and was produced by GNS Science. At the time of publication it represented the most current collection of structure data for New Zealand in a single dataset at a scale of 1:250 000. The dataset is stored in an ESRI vector geodatabase and exported to ArcGIS Server. The dataset comprises points with each point having attributes describing the type of structure, its dip and dip direction. The data structure complies with the GeoSciML 4.1 standard where relevant and uses the appropriate CGI Controlled Vocabularies. The mapping frame is defined as 'surface geology'. The data should not be used at scales beyond that for which it was prepared. The spatial accuracy is estimated to be no better than +/- 250 m.
-
This dataset has been superseded by a new edition (3rd edition, 2020) available here: https://data.gns.cri.nz/metadata/srv/eng/catalog.search#/metadata/5F6780CB-4135-4204-A2C8-50DD74B0466F. This 2nd edition has been kept as a historical archive and is available on request.. This dataset is the lineament data for New Zealand. The dataset is a product of the QMAP Geological Map of New Zealand Project and was produced by GNS Science. At the time of publication it represented the most current mapping of linears for New Zealand in a single dataset at a scale of 1:250 000. The dataset is stored in an ESRI vector geodatabase and exported to ArcGIS Server. The dataset comprises arcs with each arc having attributes describing the accuracy of location and type of lineament. The data structure complies with the GeoSciML 4.1 standard where relevant and uses the appropriate CGI Controlled Vocabularies. The mapping frame is defined as 'surface geology'. The data should not be used at scales beyond that for which it was prepared. The spatial accuracy is estimated to be no better than +/- 250 m.
-
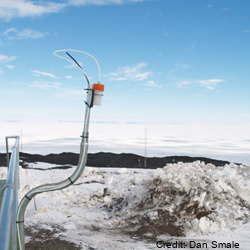
Measurements of boundary layer concentration of ozone are made with insitu instruments that samples air continuously at Arrival Heights, Antarctica and is part of the NOAA Global Monitoring Surface Ozone Network. Original measurements at Arrival Heights were made with a Dasibi Environmental Corp in situ analyser. This was replaced with a TEI-49c in situ analyser. The TEI-49c is owned by NOAA and operated by NIWA at Arrival Heights until October 2023. In October 2023 operation of the TEI was transferred to the USAP Arrival Heights laboratory along with operational responsibility (between NOAA and USAP). This data set contains continuous UV photometric data of surface level ozone collected at 6m above ground level. Data records consist of UTC time, date, and processed ozone mixing ratio (parts per billion). Data is collected from global locations and is provided in 1 minute and 1 hour averages. Data are archived at the NOAA National Climatic Data Center (NCDC), but are produced and available from NOAA Earth System Research Laboratory (ESRL). Instrument timeline: - Dasibi 1997-2003 - TEI49c 2003 – October 2023 - TEI49i November 2023 -present at USAP Arrival Heights laboratory GET DATA: https://gml.noaa.gov/aftp/data/ozwv/SurfaceOzone/ARH/
-
This dataset has been superseded by a new edition (3rd edition, 2020) available here: https://data.gns.cri.nz/metadata/srv/eng/catalog.search#/metadata/5F6780CB-4135-4204-A2C8-50DD74B0466F. This 2nd edition has been kept as a historical archive and is available on request.. This dataset is the resources data for New Zealand. The dataset is a product of the QMAP Geological Map of New Zealand Project and was produced by GNS Science. It represents a slightly updated selection of the data available from the Geological Resource Map of New Zealand (GERM) dataset. The dataset is stored in an ESRI vector geodatabase and exported to ArcGIS Server. The dataset comprises points with each point having attributes describing the type of site and the commodity. The data structure complies with the GeoSciML 4.1 standard where relevant and uses the appropriate CGI Controlled Vocabularies. The mapping frame is defined as 'surface geology'. The data should not be used at scales beyond that for which it was prepared. The spatial accuracy is estimated to be no better than +/- 250 m.
-
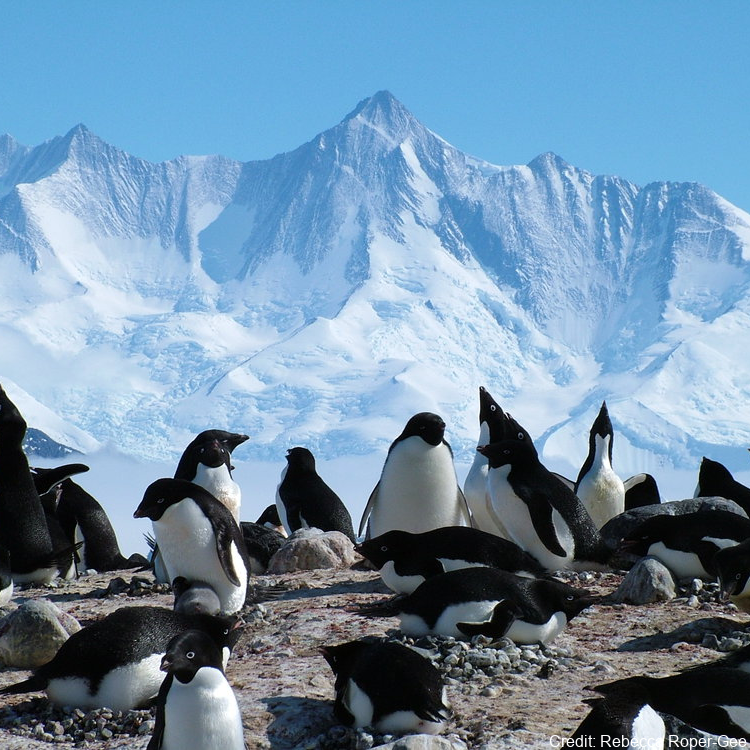
Polar regions are experiencing some of the most dramatic effects of climate change resulting in large-scale changes in sea ice cover. Despite this, there are relatively few long-term studies on polar species that evaluate the full scope of these effects. Over the last two decades, this team has conducted globally unique demographic studies of Adélie penguins in the Ross Sea, Antarctica, to explore several potential mechanisms for population change. This five-year project will use penguin-borne sensors to evaluate foraging conditions and behavior and environmental conditions on early life stages of Adélie penguins. Results will help to better understand population dynamics and how populations might respond to future environmental change. To promote STEM literacy, education and public outreach efforts will include multiple activities. The PenguinCam and PenguinScience.com website (impacts of >1 million hits per month and use by >300 classrooms/~10,000 students) will be continued. Each field season will also have ‘Live From the Penguins’ Skype calls to classes (~120/season). Classroom-ready activities that are aligned with Next Generation Science Standards will be developed with media products and science journal papers translated to grade 5-8 literacy level. The project will also train early career scientists, postdoctoral scholars, graduate students and post-graduate interns. Finally, in partnership with an Environmental Leadership Program, the team will host 2-year Roger Arliner Young Conservation Fellow, which is a program designed to increase opportunities for recent college graduates of color to learn about, engage with, and enter the environmental conservation sector. Further details are provided at: Morandini, V., Dugger, K. M., Schmidt, A. E., Varsani, A., Lescroël, A., Ballard, G., Lyver, P. O., Barton, K., & Ainley, D. G. (2024). Sex-specific recruitment rates contribute to male-biased sex ratio in Adélie penguins. Ecology and Evolution, 14, e10859. https://doi.org/10.1002/ece3.10859 GET DATA: https://doi.org/10.15784/601444
-
This dataset has been superseded by a new edition (3rd edition, 2020) available here: https://data.gns.cri.nz/metadata/srv/eng/catalog.search#/metadata/5F6780CB-4135-4204-A2C8-50DD74B0466F. This 2nd edition has been kept as a historical archive and is available on request.. This dataset is the faults data for New Zealand. The dataset is a product of the QMAP Geological Map of New Zealand Project and was produced by GNS Science. At the time of publication it represented the most current mapping of the faults of New Zealand in a single dataset at a scale of 1:250 000. The dataset aligns with features included in the 1:250 000 Active Faults Database as at June 2017. The dataset is stored in an ESRI vector geodatabase and exported to ArcGIS Server. The dataset comprises arcs with each arc having attributes describing the type of fault and sense and age of movement. The data structure complies with the GeoSciML 4.1 standard for ShearDisplacementStructureView and uses the relevant CGI Controlled Vocabularies. The mapping frame is defined as 'surface geology'. The data should not be used at scales beyond that for which it was prepared. The spatial accuracy is estimated to be no better than +/- 250 m.
-
This dataset has been superseded by a new edition (3rd edition, 2020) available here: https://data.gns.cri.nz/metadata/srv/eng/catalog.search#/metadata/5F6780CB-4135-4204-A2C8-50DD74B0466F. This 2nd edition has been kept as a historical archive and is available on request.. This dataset is the landslide boundaries data for New Zealand. The dataset is a product of the QMAP Geological Map of New Zealand Project and was produced by GNS Science. At the time of publication it represented the most current mapping of landslide boundaries for New Zealand in a single dataset at a scale of 1:250 000. The dataset is stored in an ESRI vector geodatabase and exported to ArcGIS Server. The dataset comprises arcs with each arc having attributes describing the type of contact and its accuracy. The data structure complies with the GeoSciML 4.1 standard where relevant and uses the appropriate CGI Controlled Vocabularies. The mapping frame is defined as 'surface geology'.\ The data should not be used at scales beyond that for which it was prepared. The spatial accuracy is estimated to be no better than +/- 250 m.
-

This metadata record represents six GPS timeseries on the Ross Ice Shelf. The objectives of this programme are to obtain ground truth high-resolution positional information at six sites spanning over ~300 km over the northwestern ice shelf. This positional data is processed to generate ice flow speed (velocity) measurements. In obtaining high frequency velocity measurements from this data, we will have a more detailed record of ice flow variability allowing us to more confidently determine what the climatic and dynamic drivers of change are. Furthermore, in generating this multi-year record, we can better observe the present evolution of the ice sheet and use this information to project future change. This velocity data will be used to both validate summer observations of velocity from satellites, in addition to supplementing the unobservable months over winter. Combining this data with modelling will allow us to directly determine the climatic and dynamic drivers of variability, and better understand the response of the ice shelf to future climate change. GET DATA: nicholas.golledge@vuw.ac.nz
-
This dataset has been superseded by a new edition (3rd edition, 2020) available here: https://data.gns.cri.nz/metadata/srv/eng/catalog.search#/metadata/5F6780CB-4135-4204-A2C8-50DD74B0466F. This 2nd edition has been kept as a historical archive and is available on request.. This dataset is the veins data for New Zealand. The dataset is a product of the QMAP Geological Map of New Zealand Project and was produced by GNS Science. At the time of publication it represented the most current mapping of veins for New Zealand in a single dataset at a scale of 1:250 000. The dataset is stored in an ESRI vector geodatabase and exported to ArcGIS Server. The dataset comprises arcs with each arc having attributes describing the rock type, its age and stratigraphic nomenclature. The data structure complies with the GeoSciML 4.1 standard where relevant and uses the appropriate CGI Controlled Vocabularies. The mapping frame is defined as 'surface geology'. The data should not be used at scales beyond that for which it was prepared. The spatial accuracy is estimated to be no better than +/- 250 m.
-
This dataset has been superseded by a new edition (3rd edition, 2020) available here: https://data.gns.cri.nz/metadata/srv/eng/catalog.search#/metadata/5F6780CB-4135-4204-A2C8-50DD74B0466F. This 2nd edition has been kept as a historical archive and is available on request.. This dataset is the horizons data for New Zealand. The dataset is a product of the QMAP Geological Map of New Zealand Project and was produced by GNS Science. At the time of publication it represented the most current mapping of horizons for New Zealand in a single dataset at a scale of 1:250 000. The dataset is stored in an ESRI vector geodatabase and exported to ArcGIS Server. The dataset comprises arcs with each arc having attributes describing the horizon name, lithology, contact relationships, geologic history and age. Typically horizons are geological units with limited width and may form the contact between adjacent geologic polygons. The data structure complies with the GeoSciML 4.1 standard for both ContactView and GeologicUnitView and uses the relevant CGI Controlled Vocabularies. The mapping frame is defined as 'surface geology'. The data should not be used at scales beyond that for which it was prepared. The spatial accuracy is estimated to be no better than +/- 250 m.