 GeoData.NZ
New Zealand Antarctic Science Platform
Type of resources
Topics
Keywords
Contact for the resource
Provided by
Years
Update frequencies
status
-
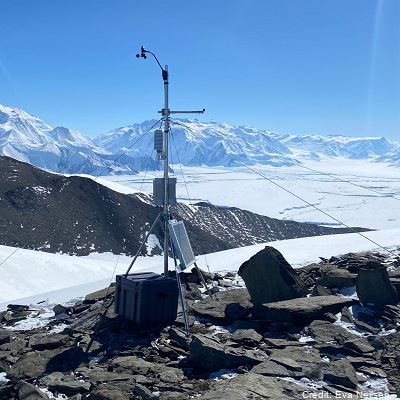
Automated weather stations were installed to measure local scale weather conditions at Miers Valley, Miers Ridge, Commonwealth Glacier, Cape Christie, and Haystack Mountain. Miers Valley, Miers Ridge and Haystack Mountain stations have been operating since early 2021. Commonwealth Glacier and Cape Christie were installed in December 2022, and 2023, respectively. Data are available on request in NetCDF. Parameters: - average air temperature (C) - average relative humidity (%) - average short wave in (W/m2) - average pressure (hPa) - wind speed (ms-1) - wind direction (true bearing degrees) - wind standard deviation Coordinates: - Miers Valley (-78.09805, 163.794283) - Miers Ridge (-78.123205, 163.863319) - Commonwealth Glacier (-77.563987, 163.281064) - Cape Christie (-72.29722222, 169.9847222) - Haystack Mountain (-77.05, 162.585) GET DATA: marwan.katurji@canterbury.ac.nz
-
Geophysical observations around the Kamb Ice Stream 2 borehole (-82.47040333, -152.29192167). Seasonal and winter-over GPS deployments were used to capture the motion of the ice stream and ice shelf with a particular focus on the grounding zone. Total stations will also be used to monitor ice motion and deformation. These data combined provide boundary conditions and reveal controlling processes (ice deformation and tidal processes). GET DATA: r.levy@gns.cri.nz
-
AntAir ICE is an air temperature dataset for terrestrial Antarctica, the ice shelves, and the seasonal sea ice around Antarctica in a 1km2 spatial grid resolution and a daily temporal resolution available from 2003-2021. AntAir ICE was produced by modelling air temperature from MODIS ice surface temperature and land surface temperature using linear models. In-situ measurements of air temperature from 117 Automatic Weather Stations were used as the response variable. Each day has a bricked spatial raster with two layers, saved as a GeoTIFF format and in the Antarctic Polar Stereographic projection (EPSG 3031). The first layer is the predicted near surface air temperature for that day in degree Celsius * 10 and the second layer is the number of available MODIS scenes for that day ranging from 0 to 4. Areas with cloud contamination or without sea ice are marked with no data. Files for each year (2003-2021) are compressed with a ZIP files for each quarter. Python 3.8 was used for conversion of the MODIS products from HDF files to raster and all data handling and processing was thereafter done in R version 4.0.0. All data processing and modelling procedures are available as R scripts on a public Github repository: https://github.com/evabendix/AntAir-ICE. Using this code it is possible to download new available MODIS LST and IST scenes and apply the model to continue the near-surface air temperature dataset. Related Publication: https://doi.org/10.1038/s41597-023-02720-z GET DATA: https://doi.org/10.1594/PANGAEA.954750
-

This metadata record represents six GPS timeseries on the Ross Ice Shelf. The objectives of this programme are to obtain ground truth high-resolution positional information at six sites spanning over ~300 km over the northwestern ice shelf. This positional data is processed to generate ice flow speed (velocity) measurements. In obtaining high frequency velocity measurements from this data, we will have a more detailed record of ice flow variability allowing us to more confidently determine what the climatic and dynamic drivers of change are. Furthermore, in generating this multi-year record, we can better observe the present evolution of the ice sheet and use this information to project future change. This velocity data will be used to both validate summer observations of velocity from satellites, in addition to supplementing the unobservable months over winter. Combining this data with modelling will allow us to directly determine the climatic and dynamic drivers of variability, and better understand the response of the ice shelf to future climate change. GET DATA: nicholas.golledge@vuw.ac.nz
-
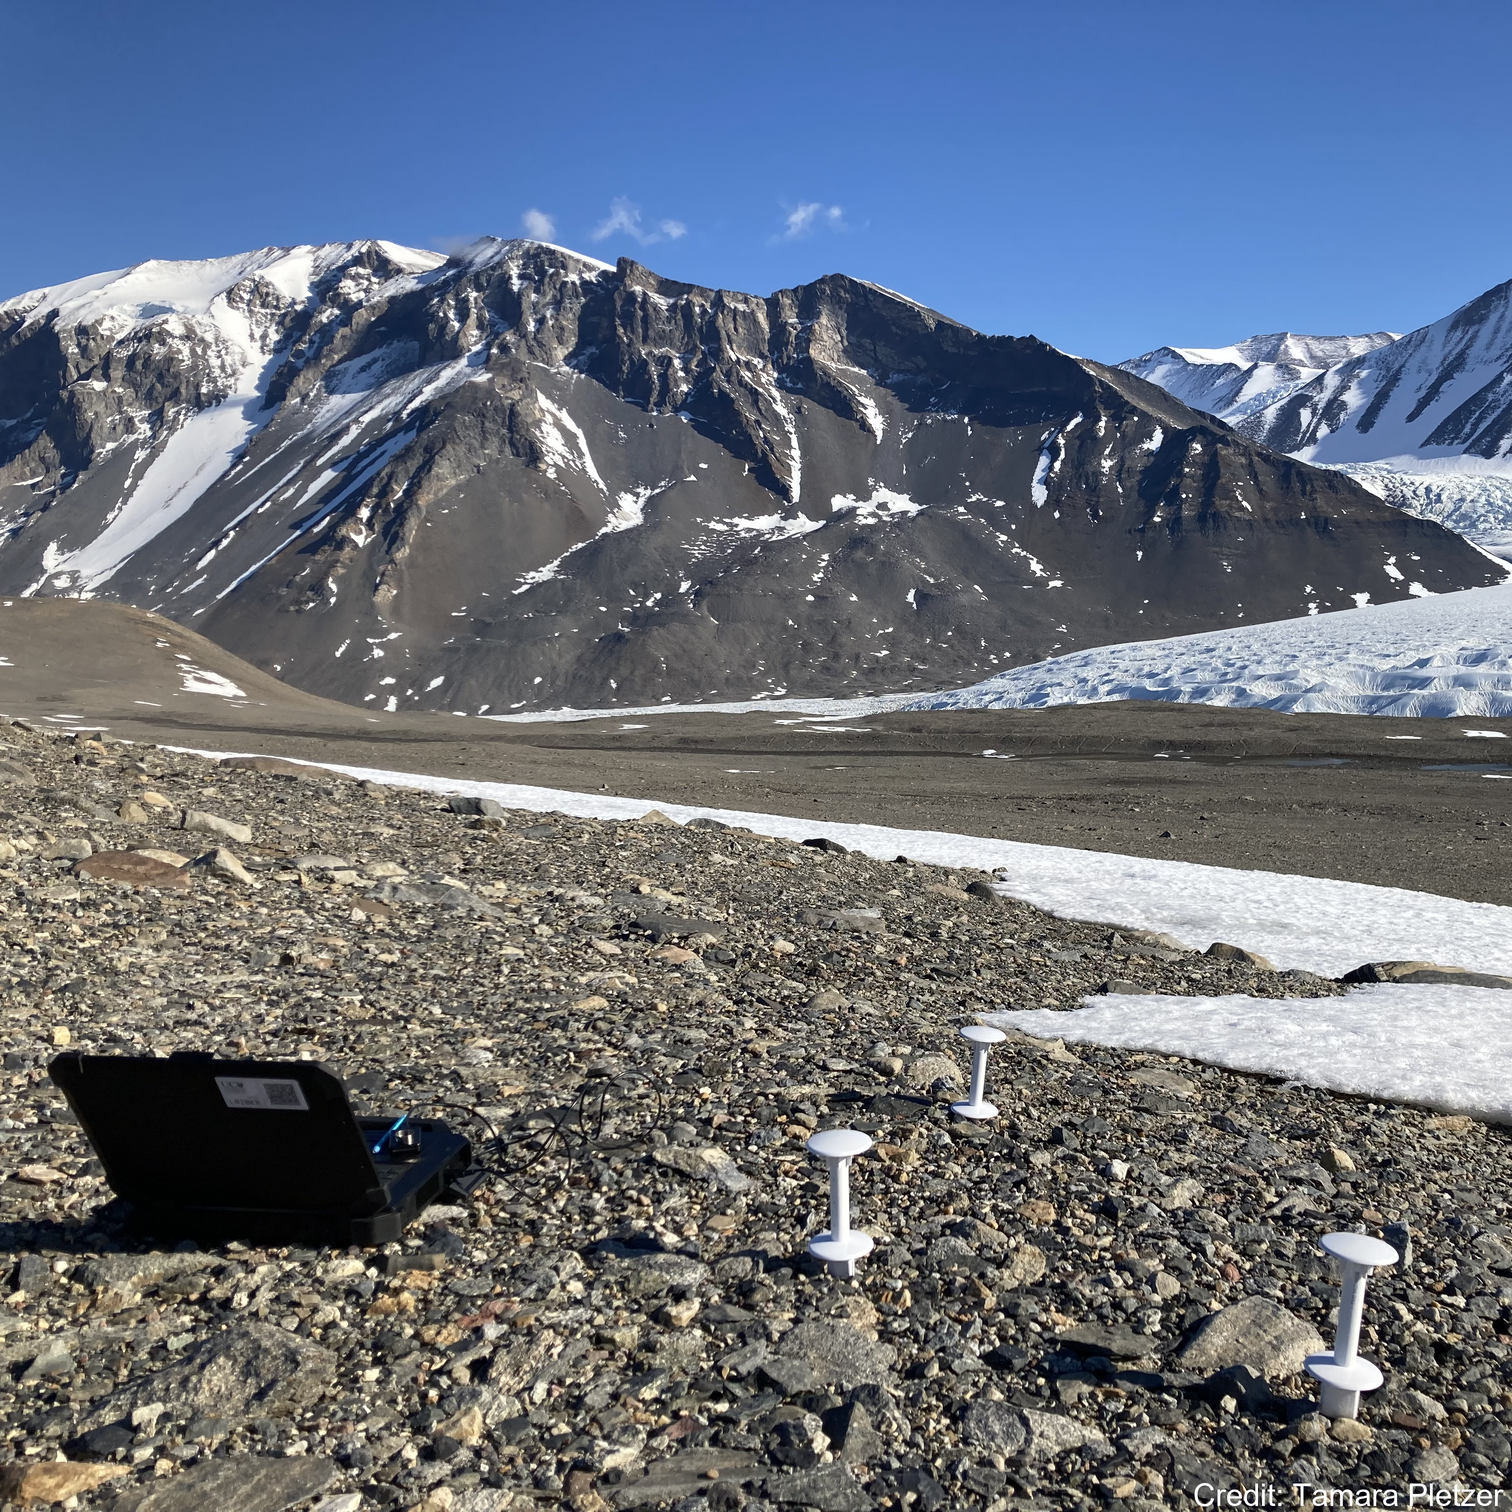
50 TMS Soil Sensors were deployed in Taylor Valley from December 2021-January 2023 to measure temperature (air, land surface and soil) and soil moisture. The sensors record data every 15 minutes and are placed in nested plots of 2x 1km^2 plots with 3x30m^2 nests and 3 sensors in 3 x 1m^2 plots. Data are available in csv file format. GET DATA: tamara.pletzer@postgrad.otago.ac.nz or marwan.katurji@canterbury.ac.nz
-

This metadata record represents the data from 15 passive seismic stations at Kamb Ice Stream (site 2). Seismic stations measure vibrations in the ice providing boundary conditions and revealing controlling processes (ice-substrate interaction). Seismometers were deployment within 50 km radius of KIS2 borehole (subglacial channel). GET DATA: r.levy@gns.cri.nz
-

An oceanographic mooring at the Kamb Ice Stream site 3 borehole (-82.6285, -156.3046) - consisting of two RBR Concertos (CTDs) to measure conductivity, temperature, and pressure and two Nortek Aquadopp current meters. The instruments are located at 555 m and 510 m below sea level (Figure 20). Figure 20 shows the final configuration and deployment positions of the mooring instrumentation. There is a paired CTD and current meter at the top and bottom of the water cavity. The CTDs are measuring every 20 minutes whilst the current meters are measuring every half an hour. The top logger box interrogates each instrument once an hour to collect all individual samples, these are then averaged and sent. Every day at approximately 12:00 NZST, the data from the mooring is telemetered over SDB Iridium (Short Burst Data) in binary. Periodically, each set of transmission data are compiled and decoded. They are then parsed through a series of scripts and output as a table. These data target a major subglacial outlet river emerging from beneath the Kamb Ice Stream to determine both the role of water beneath the ice sheets and the ice-ocean interactions that take place once this water emerges into the ice shelf cavity. GET DATA: craig.stevens@niwa.co.nz
-

This metadata represents ApRES (Autonomous phase-sensitive Radio Echo Sounder) measurements conducted at Kamb Ice Stream 2 (KIS2) since 2019. Experimental imaging ApRES profiling across the channel axis and low-frequency radar profiling were used in a grid pattern around the KIS2 borehole. ApRES observations and radar profiles were carried out both at and near the boreholes at both sites, with gridded observations extending over multiple kilometers around each borehole. A continuous ApRES deployment has been established, consisting of multiple stations that recorded observations at 15-minute intervals. The data collection included transects and short-term (several weeks) repeat measurements across key features, such as the grounding zone and subglacial channel, within a 50-kilometer radius of the borehole. This dataset provides subglacial dynamic and structural characteristic data of the Kamb Ice Stream. GET DATA: r.levy@gns.cri.nz
-

Data target a major subglacial outlet river emerging from beneath the Kamb Ice Stream (KIS). These data were used to determine both the role of water beneath the ice sheets and the ice-ocean interactions that take place once this water emerges into the ice shelf cavity. GET DATA: craig.stevens@niwa.co.nz
-

This metadata represents ApRES (Autonomous phase-sensitive Radio Echo Sounder) measurements conducted at Kamb Ice Stream 3 (KIS3). . GET DATA: r.levy@gns.cri.nz