 GeoData.NZ
2021
Type of resources
Available actions
Topics
Keywords
Contact for the resource
Provided by
Years
Formats
Representation types
Update frequencies
status
Scale
Resolution
-
Orthophotography of the urban areas within Kapiti Coast District, flown in January 2021. Imagery was captured for the ‘Kapiti Coast District Council’ by AAM NZ Limited, 6 Ossian St, NAPIER, New Zealand. Data comprises: • 2,685 x ortho-rectified RGB GeoTIFF images in NZTM projection, tiled into the LINZ Standard 1:500 tile layout. • Tile layout in NZTM projection containing relevant information. The supplied imagery is in terms of New Zealand Transverse Mercator (NZTM) map projection. Please refer to the supplied tile layout shape file for specific details, naming conventions, etc. Imagery supplied as 7.5cm pixel resolution (0.2m GSD), 3-band (RGB) uncompressed GeoTIFF. The final spatial accuracy is ±0.2m @ 90% confidence level. Index tiles for this dataset are available as layer [Kapiti Coast 0.075 Urban Aerial Photos Index Tiles (2021)](http://data.linz.govt.nz/layer/105822).
-
Orthophotography within the Bay of Plenty Region captured in the flying season of 2021-2022. Coverage encompasses eastern Bay of Plenty. Imagery was captured for BOPLASS Limited by AAM NZ Ltd, 6 Ossian St, Napier, New Zealand. Data comprises: • 6064 ortho-rectified RGB GeoTIFF images in NZTM projection, tiled into the LINZ Standard 1:2000 tile layout • Tile layout in NZTM projection containing relevant information. The supplied imagery is in terms of New Zealand Transverse Mercator (NZTM) map projection. Please refer to the tile index layer for specific details, naming conventions, etc. Imagery supplied as 20cm pixel resolution (0.2m GSD), 3-band (RGB) uncompressed GeoTIFF. The final spatial accuracy is ±0.6 at 90% confidence level in clear flat areas. Index tiles for this dataset are available as layer [Bay of Plenty 0.2m Rural Aerial Photos Index Tiles (2021-2022)](http://data.linz.govt.nz/layer/110914)
-
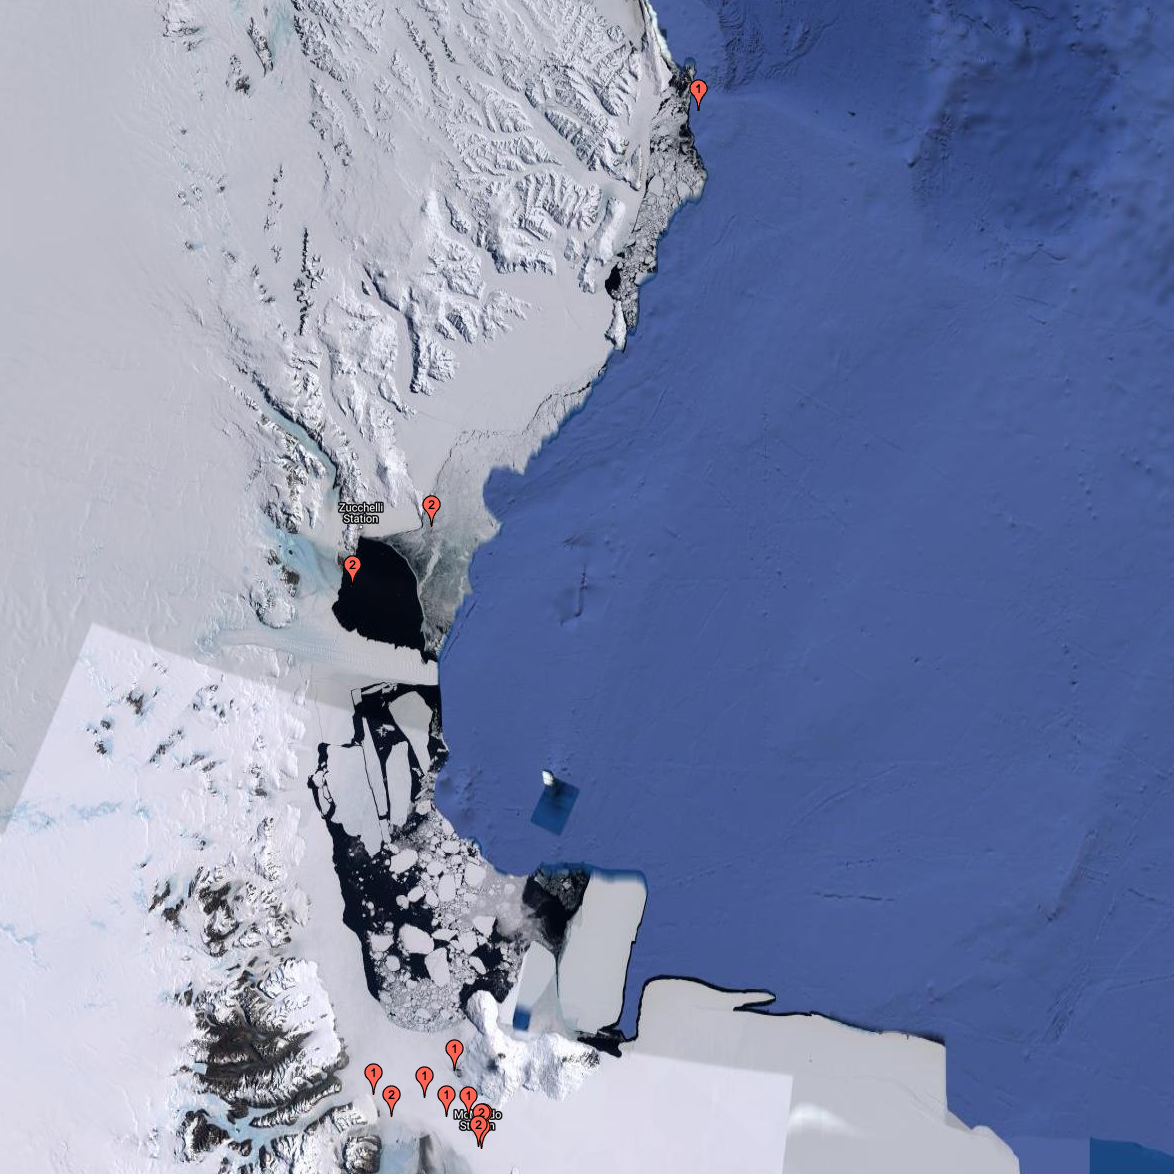
Data of apparent ice thickness from airborne electromagnetic (AEM) surveys of fast ice in McMurdo Sound, Antarctica, carried out in Nov/Dec 2009, 2011, 2013, 2016, and 2017. Values are given for apparent thicknesses derived from both, in-phase and quadrature signals. The difference between both thicknesses is a scaled measure of sub-ice platelet layer thickness. Data are from east-west transects across McMurdo Sound, at fixed latitudes. Data were smoothed and interpolated onto a regular longitude grid (0.001 degree increments). More information can be found in Haas et al. (2021). Related Publication: Haas, C., Langhorne, P. J., Rack, W., Leonard, G. H., Brett, G. M., Price, D., Beckers, J. F., and Gough, A. J.: Airborne mapping of the sub-ice platelet layer under fast ice in McMurdo Sound, Antarctica, The Cryosphere, 15, 247–264, https://doi.org/10.5194/tc-15-247-2021, 2021
-
This layer contains the DSM for LiDAR data in the Kapiti District and includes Kapiti coast, Paraparaumu, Paekākāriki, Ōtaki and the surrounding area captured in 2021. - The DEM is available as layer [Kapiti Coast LiDAR 1m DEM (2021)](https://data.linz.govt.nz/layer/106990) - The index tiles are available as layer [Kapiti Coast LiDAR Index Tiles (2021)](https://data.linz.govt.nz/layer/106983) - The LAS point cloud and vendor project reports are available from [OpenTopography](https://portal.opentopography.org/datasets?loc=New%20Zealand) LiDAR was captured for the Kapiti Coast District Council by AAM Ltd from 13 March to 15 March 2021. The dataset was generated by AAM and their subcontractors. Data management and distribution is by Toitū Te Whenua Land Information New Zealand. Data comprises: - DEM: tif or asc tiles in NZTM2000 projection, tiledinto a 1:1,000 tile layout - DSM: tif or asc tiles in NZTM2000 projection, tiled into a 1:1,000 tile layout - Point cloud: las tiles in NZTM2000 projection, tiled into a 1:1,000 tile layout Pulse density specification is at a minimum of 8 pulses/square metre. Vertical Accuracy Specification is +/- 0.1m (95%) Horizontal Accuracy Specification is +/- 0.5m (95%) Vertical datum is NZVD2016.
-
Orthophotography within the Canterbury Region captured in January and February 2021 totalling approximately 193km2. Coverage encompasses urban areas in the Waimakariri District, including Rangiora, Kaiapoi, Pegasus, Woodend, Oxford, and Mandeville North. Imagery was captured for Waimakariri District Council by Aerial Surveys Ltd, Unit A1, 8 Saturn Place, Albany 0632, New Zealand. Data comprises: • 2437 ortho-rectified RGB GeoTIFF images in NZTM projection, tiled into the LINZ Standard 1:500 tile layout • Tile layout in NZTM projection containing relevant information. The supplied imagery is in terms of New Zealand Transverse Mercator (NZTM) map projection. Please refer to the tile index layer for specific details, naming conventions, etc. Imagery supplied as 5cm pixel resolution (0.05m GSD), 3-band (RGB) uncompressed GeoTIFF. The final spatial accuracy is ±0.1m at 0.95 confidence level in clear flat areas. Index tiles for this dataset are available as layer [Waimakariri 0.05m Urban Aerial Photos Index Tiles (2021)](http://data.linz.govt.nz/layer/106374)
-
This layer contains the index tiles for LiDAR data for Stewart Island / Rakiura and includes Oban and the surrounding area captured in 2021. - The DEM is available as layer [Stewart Island / Rakiura - Oban LiDAR 1m DEM (2021)](https://data.linz.govt.nz/layer/107474/) - The DSM is available as layer [Stewart Island / Rakiura - Oban LiDAR 1m DSM (2021)](https://data.linz.govt.nz/layer/107475/) - The LAS point cloud and vendor project reports are available from [OpenTopography](https://portal.opentopography.org/datasets?loc=New%20Zealand) LiDAR was captured for Environment Southland by ASL Ltd on 3 September 2021. The dataset was generated by ASL and their subcontractors. Data management and distribution is by Toitū Te Whenua Land Information New Zealand. Data comprises: - DEM: tif or asc tiles in NZTM2000 projection, tiledinto a 1:1,000 tile layout - DSM: tif or asc tiles in NZTM2000 projection, tiled into a 1:1,000 tile layout - Point cloud: las tiles in NZTM2000 projection, tiled into a 1:1,000 tile layout Pulse density specification is at a minimum of 4 pulses/square metre. Vertical Accuracy Specification is +/- 0.2m (95%) Horizontal Accuracy Specification is +/- 1.0m (95%) Vertical datum is NZVD2016.
-
Index Tiles ONLY, for actual orthophotos see layer [Otago 0.3m Rural Aerial Photos (2019-2021)](http://data.linz.govt.nz/layer/106403) Orthophotography within the Otago Region taken in the flying seasons (summer periods) 2019-2021. Coverage is of the Otago region covering parts of Central Otago and Clutha Districts. Imagery was captured for Otago Regional Council by Aerial Surveys Ltd, Unit A1, 8 Saturn Place, Rosedale,0632, New Zealand. Data comprises: •2669 ortho-rectified RGB GeoTIFF images in NZTM projection, tiled into the LINZ Standard 1:5,000 tile layout •Tile layout in NZTM projection containing relevant information. The supplied imagery is in terms of New Zealand Transverse Mercator (NZTM) map projection. Imagery supplied as 30 cm pixel resolution (0.30 m GSD), 3-band (RGB) uncompressed GeoTIFF. The final spatial accuracy is ±0.5 m @ 95% confidence level.
-
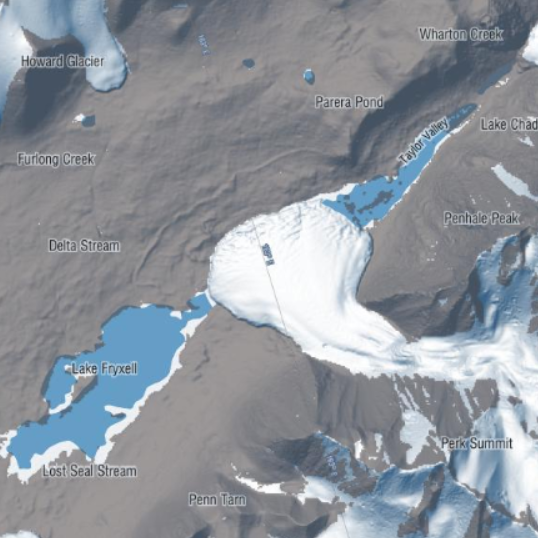
This metadata record represents meteorological data and in situ and isotopic measurements of the isotopic ratio of water vapor from the ablating ice from two lakes in the McMurdo Dry Valleys, Antarctica. Lake ice and water samples (from the surface water and at depth via SCUBA) were collected in vials. Ice samples at Lake Bonney were collected daily, and at Lake Fryxell samples were collected approximately twice per day. Lake ice samples were also collected at Lake Fryxell along three transects spaced approximately every 300 to 500 m (meters) across the lake surface. Water vapor isotope flux measurements were collected via air inlets which were installed at 0.5, 1.0, and 3.0 m on the tower using ¼″ OD Teflon tubes. The lines were insulated and continuously pumped at a flow rate of approximately 10 L min−1 using a secondary pump. Meteorological measurements with a Vaisala HMP100 probe for temperature and relative humidity readings and an RM Young wind vane (model 05108) for wind velocity measurements, at heights of 3.0 and 0.5 m. Air temperature, relative humidity, wind velocity, and lake surface temperature measurements were recorded every minute via a Campbell Scientific CR1000 data logger. Spatial Coordinates: Lake Bonney (-77.60672778, 162.44982222) Lake Fryxell (-77.60672778, 163.12508611) Further details are provided at: A. W. Bellagamba, M. Berkelhammer, L. Winslow, P. T. Doran, K. F. Myers, S. Devlin & I. Hawes (2021) The magnitude and climate sensitivity of isotopic fractionation from ablation of Antarctic Dry Valley lakes, Arctic, Antarctic, and Alpine Research, 53:1, 352-371, https://doi.org/10.1080/15230430.2021.2001899 GET DATA: https://uofi.app.box.com/s/6vakvltbsn1nhrpzudffclrn5iufpoux/folder/88268262341
-
Index Tiles ONLY, for actual orthophotos see layer [Selwyn 0.075m Urban Aerial Photos (2020-2021)](http://data.linz.govt.nz/layer/106973) Orthophotography within the Canterbury Region captured in the flying season of 2020-2021. Coverage encompasses Lincoln, Rolleston, West Melton and Prebbleton. Imagery was captured for Environment Canterbury by Landpro Ltd, 13 Pinot Noir Drive, Cromwell 9310, New Zealand. Data comprises: • 548 ortho-rectified RGB GeoTIFF images in NZTM projection, tiled into the LINZ Standard 1:500 tile layout • Tile layout in NZTM projection containing relevant information. The supplied imagery is in terms of New Zealand Transverse Mercator (NZTM) map projection. Imagery supplied as 7.5cm pixel resolution (0.075m GSD), 3-band (RGB) uncompressed GeoTIFF. The final spatial accuracy is ±0.2m at 90% confidence level in clear flat areas.
-
This layer contains the DEM for LiDAR data for Stewart Island / Rakiura and includes Oban and the surrounding area captured in 2021. - The DSM is available as layer [Stewart Island / Rakiura - Oban LiDAR 1m DSM (2021)](https://data.linz.govt.nz/layer/107475/) - The index tiles are available as layer [Stewart Island / Rakiura - Oban LiDAR Index Tiles (2021)](https://data.linz.govt.nz/layer/107476/) - The LAS point cloud and vendor project reports are available from [OpenTopography](https://portal.opentopography.org/datasets?loc=New%20Zealand) LiDAR was captured for Environment Southland by ASL Ltd on 3 September 2021. The dataset was generated by ASL and their subcontractors. Data management and distribution is by Toitū Te Whenua Land Information New Zealand. Data comprises: - DEM: tif or asc tiles in NZTM2000 projection, tiledinto a 1:1,000 tile layout - DSM: tif or asc tiles in NZTM2000 projection, tiled into a 1:1,000 tile layout - Point cloud: las tiles in NZTM2000 projection, tiled into a 1:1,000 tile layout Pulse density specification is at a minimum of 4 pulses/square metre. Vertical Accuracy Specification is +/- 0.2m (95%) Horizontal Accuracy Specification is +/- 1.0m (95%) Vertical datum is NZVD2016.