 GeoData.NZ
University of Canterbury
Type of resources
Topics
Keywords
Contact for the resource
Provided by
Years
Update frequencies
status
-
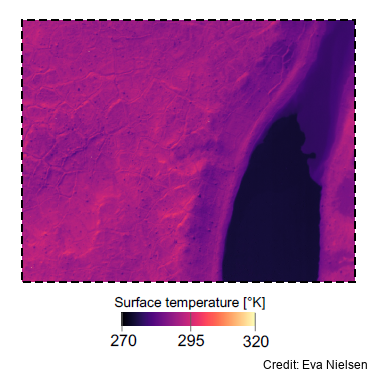
This metadata records represents aerial surveying of land temperature variability and microclimate, with an infrared and visible camera system. In December and January 2023, airborne surveys were undertaken in the Taylor Valley in the McMurdo Dry Valleys, plus one scan along the coastline to Terra Nova Bay. Pre-defined flight tracks covered three different areas, chosen for their different surfaces and moisture content. The flights were timed to coincide with MODIS and Landsat satellite overpasses The data was used to: (1) validate a newly developed geostatistical downscaling model for land surface temperature in the unique environment of the McMurdo Dry Valleys; (2) investigate bias in satellite derived land and ice surface temperature related to subpixel variations in surface types; (3) validate WRF-Hydro/Glacier model performance in simulating spatially distributed conditions for melt and the routing of meltwater; (4) lay some of the groundwork for establishing a network of ecological “sentinel sites”, where the greatest environmental change is expected. Data is in HCC format for the infrared and JPG for RGB imagery. GET DATA: eva.nielsen@pg.canterbury.ac.nz or marwan.katurji@canterbury.ac.nz
-
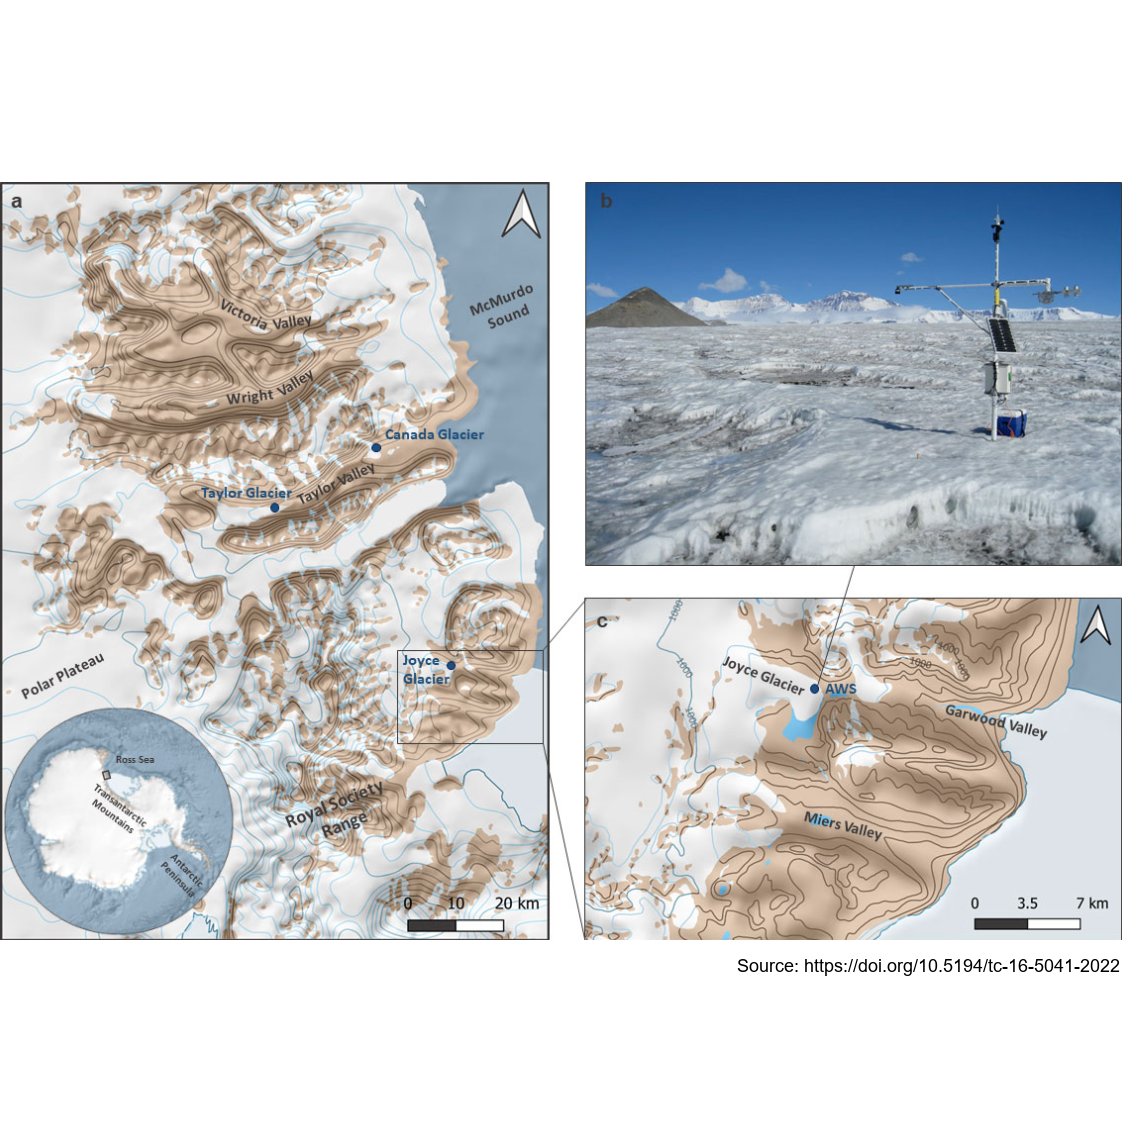
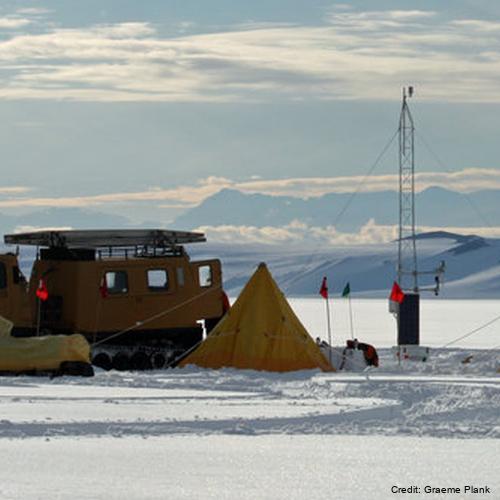
14-month record of automatic weather station (AWS) observations on Joyce Glacier. The AWS was installed on Joyce Glacier at (-78.02075000, 163.79346667), roughly 400 m above sea level on 26 November 2008 and removed on 31 January 2010. Measurements were taken every 300 s and stored as 15 min averages on a data logger. Parameters and Instruments: - Air temperature (Vaisala HMP45A) - Relative humidity (Vaisala HMP45A) - Wind speed (R. M. Young 05103) - Wind direction (R. M. Young 05103) - Air pressure (Setra CS100 270) - Shortwave radiation (Kipp & Zonen CNR1–CM3) - Longwave radiation (Kipp & Zonen CNR1–CG3) - Surface height (CSI SR50A) Further details are provided at https://doi.org/10.5194/tc-16-5041-2022 GET DATA: marwan.katurji@canterbury.ac.nz
-
The ceilometer (Vaisala CL51) provides timeseries vertical profiles of cloud backscatter, as well as cloud base height and detection status. (up to three cloud bases, where visible). The ceilometer was established in 2022. Hourly netCDF format data files containing the raw backscattered signal from the ceilometer GET DATA: adrian.mcdonald@canterbury.ac.nz
-
Fourteen SnowWEB sensor stations were used to make atmospheric/meteorological observations along the traverse route between Scott Base and Hot Water Drill Site 2, and Hot Water Drill Site 1. Instruments (e.g. thermometers) were installed on masts above the ground. 2017/18: Hot Water Drill Site 1 2018/19: 11 SnowWeb stations were deployed at approximately 16 km intervals between Hot Water Drill Site 1 (HWD1) Camp and Siple Dome The data will support modelling and remote-sensing studies linked to surface mass balance. At the same time as Phase sensitive radar measurements were made to link meteorological measurements with snow accumulation rates. GET DATA: adrian.mcdonald@canterbury.ac.nz
-
Our studies investigate the Antarctic middle atmosphere’s response to natural and man-made factors which change climate. The dynamical processes of this region are significant in controlling the circulation at lower altitudes, including the stratospheric ozone layer. The feedbacks in the atmosphere, couple this change to climate change at the surface. The seasonal behaviour of this wave-driven circulation, particularly its dependence on major disturbances in the stratosphere which result in the transport of energy and momentum by waves to higher altitudes are examined. The programme is based on continuous monitoring of winds in the middle atmosphere at altitudes of 60-100km using a ground-based medium frequency radar located at Scott Base. The Scott Base radar has been recording wind measurements since 1982 and is one of the longest duration climate records of this type of data in the world. The measurements made by the Scott Base MF radar provide valuable climate information about how the flow in the middle atmosphere (70-100 km) has changed. This record along with observations from satellite instruments allows the coupling between the middle atmosphere and the surface over Antarctica to be examined, this coupling is often associated with wave-like motions in the atmosphere that the MF radar is particularly good at observing. The circulation is dominated by pole-to-pole flow, from the summer pole to the winter pole. This circulation is largely driven by atmospheric waves with time scales from 15 minutes to 15 days. The large scale of the phenomenon benefits considerably from co-operative observations by our own radar near Christchurch, and by our US colleagues at the South Pole, Admiral Heights (from January 2000) and Tekapo. We also use satellite data for the region between Antarctica and New Zealand. This type of study is important because improvements in the predictive ability of the current generation of climate models may be particularly sensitive to the coupling processes that we examine. GET DATA: adrian.mcdonald@canterbury.ac.nz
-

The microrain radar system (MRR2) is a compact 24.23GHz FM-CW which measures accurate estimates of snowfall, the size distribution of snow and the fall velocity of hydrometeors. Rain rates and the characteristic fall velocity are derived. See MRR2 specifications: https://metek.de/product/mrr-2/
-
Air temperature, pressure, velocity, relative humidity measurements from near-surface up to around 2km above sea level were taken along the path of four height controlled free floating meteorological balloons released from Terra Nova Bay and flew over the polynya, sea ice and open waters of the Ross Sea. These data were used to investigate localized weather processes that are largely influenced by variable surface cover (ice, polynya, open water, terrain). This metadata record represents flights: 171104a, 171110a, 171117a, and 171122a. Further details are provided at: https://doi.org/10.1029/2019JD030591 GET DATA: https://www.science.smith.edu/cmet/flight.html