 GeoData.NZ
CAMERA
Type of resources
Topics
Keywords
Contact for the resource
Provided by
Years
Update frequencies
status
-

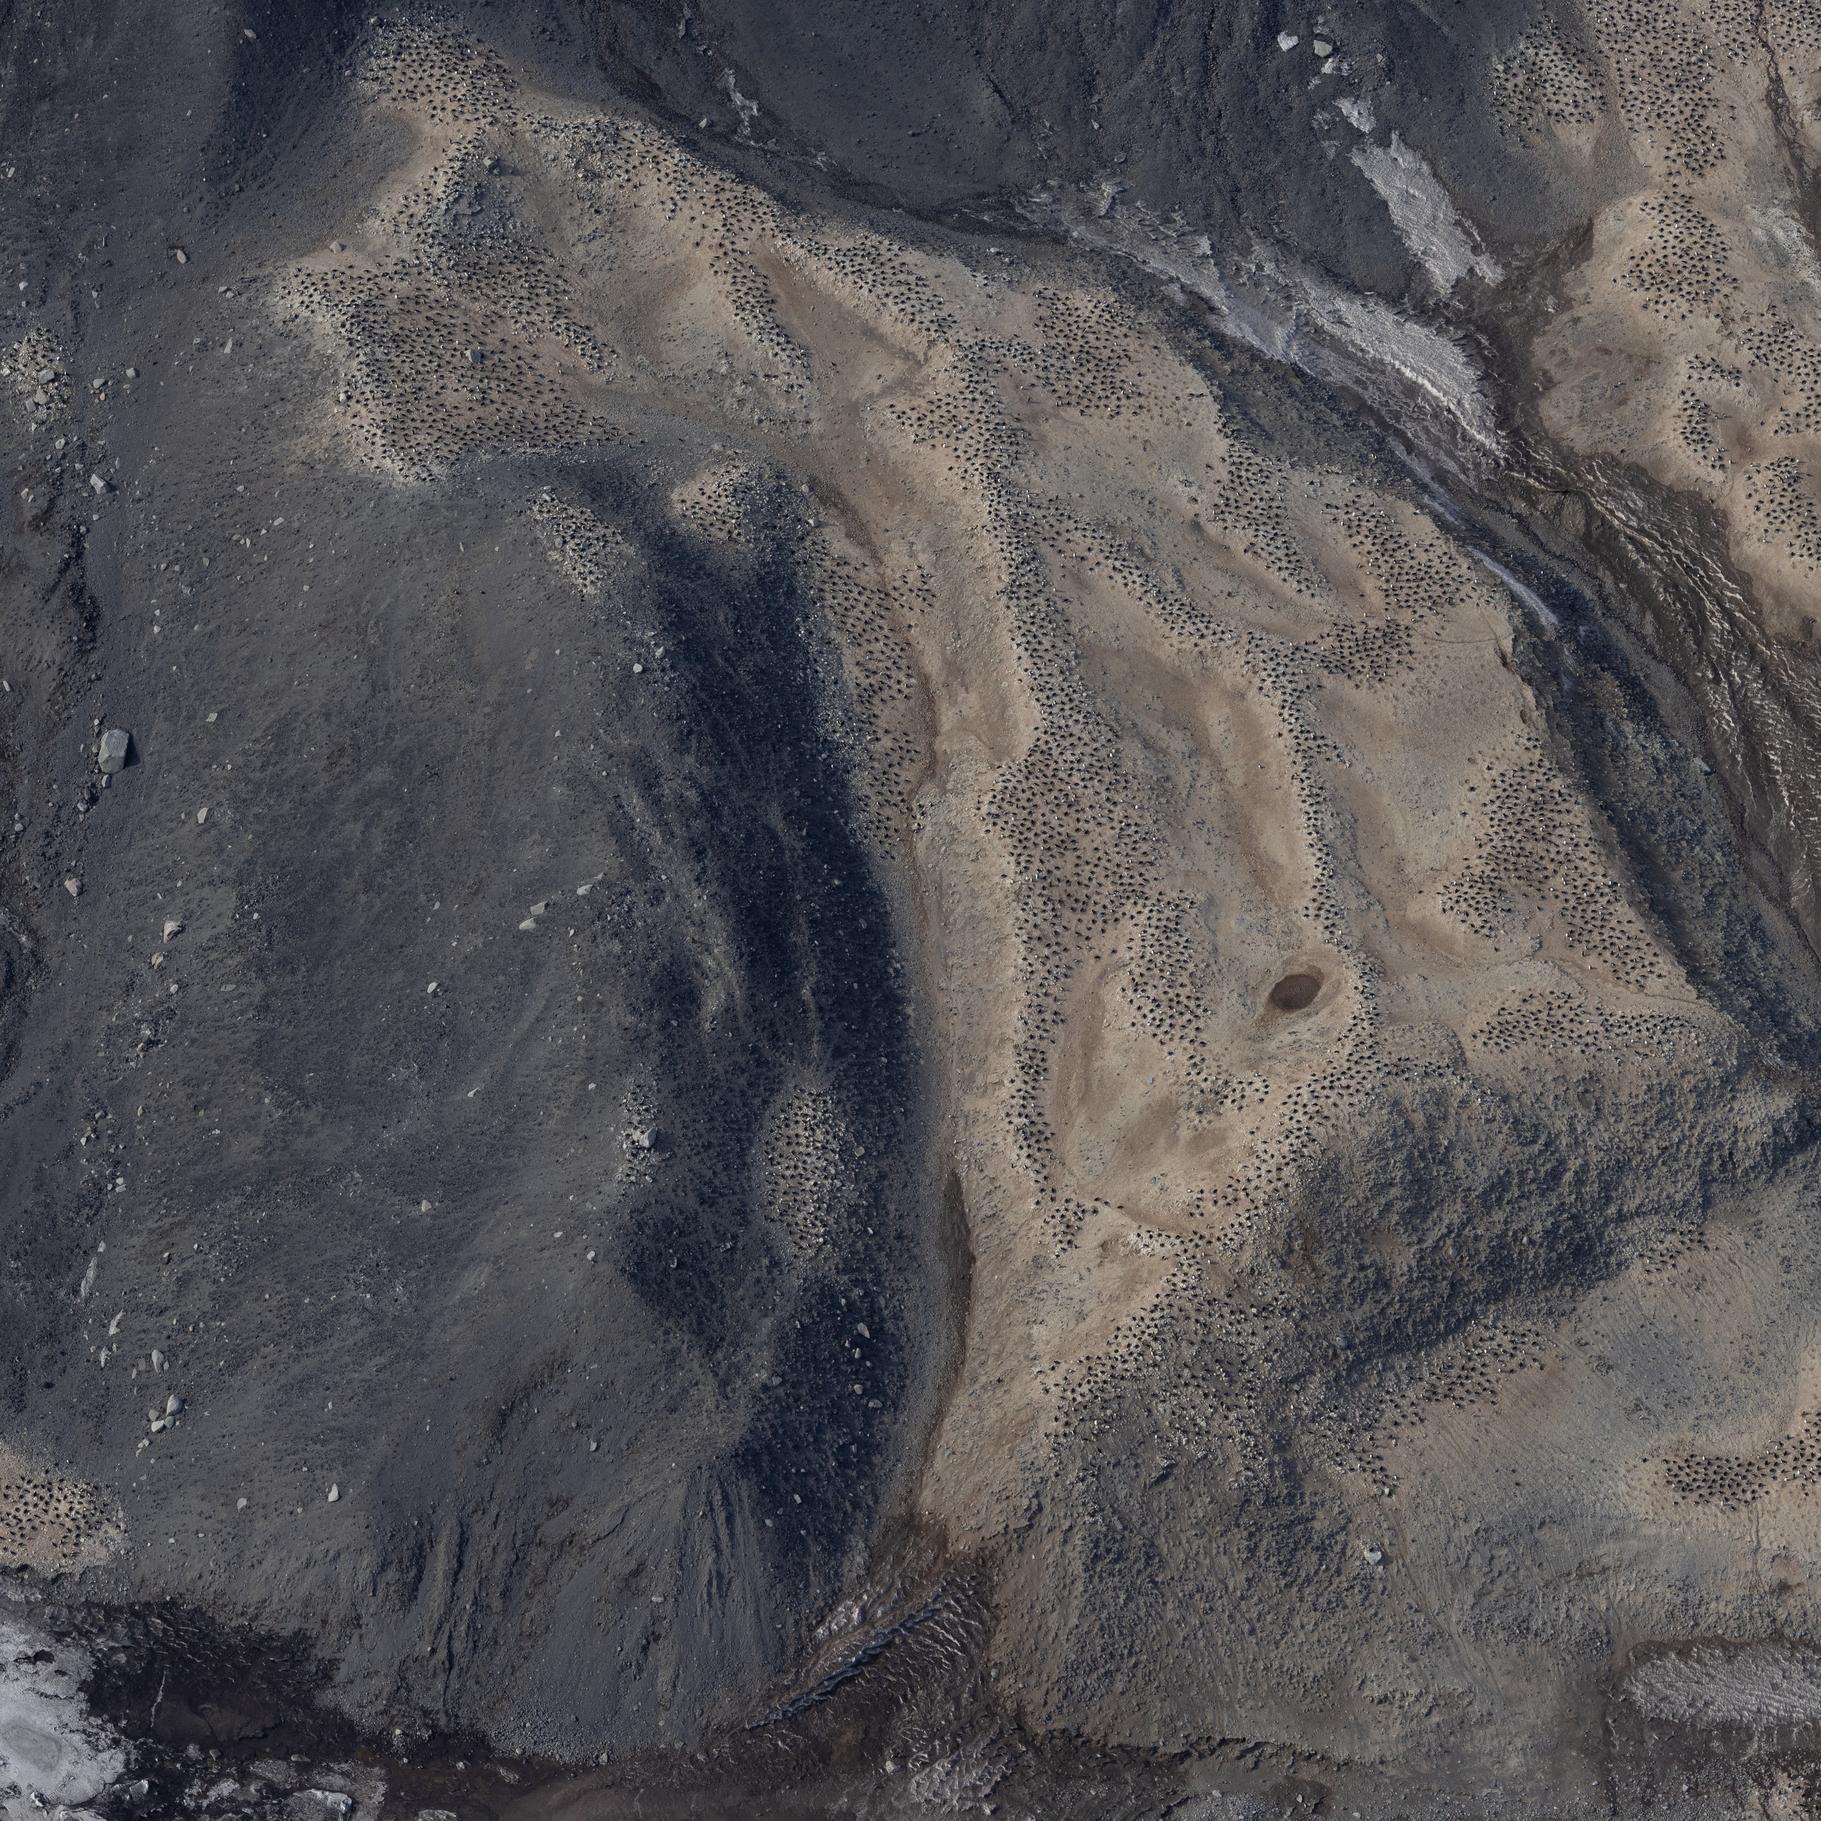
Plot data Mc Nemar: To enable comparisons with the 1961 and 2004 survey results, the Lambert Conformal Conic projection from the 2004 survey was used to precisely georeference and trim the RGB image across a 1-m2 grid, generating a total of 3,458 1-m2 grid cells. For each grid cell moss, lichen, or algae/cyanobacteria cover was extracted as one of the four cover classes: Heavy (>40%), Patchy (10–40%), Scattered (less than 10%), and None (0%) for the survey years 1962, 2004 and 2018. Ground truthing: To test the overall accuracy of cover classifications and ensure consistency with 2004 survey methodologies, a ground-truthing approach was performed. Photographs were taken of individual cells along eight transects, running west to east across the plot at 0.5, 1.5, 15.5, 16.5, 28.5, 29.5, 116.5 and 117.5 m distance from the NW corner. Each grid cell could be identified individually with an x/y coordinate in the centre and was surrounded by a rectangular frame parallel to the outer edge of the plot. A total of 174 photographs were taken and archived with Antarctica New Zealand. For each photographed grid cell, the presence of each functional group of vegetation and their cover class was assessed visually. Orthomosaic image: Aerial images were obtained using a DJI Matrice 600 Pro hex-rotor remotely piloted aircraft system equipped with a Canon EOS 5Ds camera (image size: 8688×5792 pixels, focal length: 50 mm, pixel size: 4.14 μm) on November 28, 2018. The flight altitude was 30 m above ground level, and a total of 10 ground-control points were included to provide accurate geo-referencing. An orthomosaic photo and accompanying DEM was generated with the acquired aerial images using Agisoft PhotoScan (now known as Metashape by Agisoft LLC, https://www.agisoft.com/) RELATED PUBLICATION: https://doi.org/10.1029/2022EF002823 GET DATA: https://doi.org/10.7488/ds/3417
-
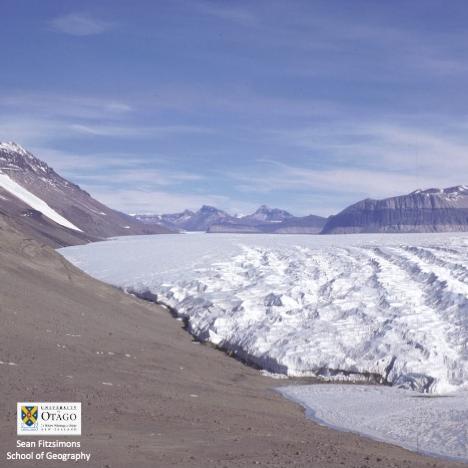
The structural glaciology and movement of the Taylor Glacier, was investigated over several seasons (98-01) by excavating a tunnel in the right side of the Taylor Glacier, 1.5km upstream of the terminus, to provide access to basal ice and the glacier substrate. Basal ice was sampled and analysed for concentration of base cations and chlorides present. Strain arrays and precision dial gauges were installed to monitor movement and deformation of the tunnel and ice velocity. In situ samples of clean and debris bearing glacier ice shear samples were taken from the basal ice to test in a laboratory. The tunnel was re-cut 1.3km upstream of the terminus in the 99-00 season as the other had closed in, with strain arrays and plumb lines installed and basal ice re-sampled. Ice cores were sampled for mechanical tests from the tunnel and the glacier surface. Ice cores were taken from the ice margin of Lake Bonny. Strain arrays and plumb lines were resurveyed and the deformation of the tunnel measured. This metadata record represents: - Data set from Taylor Glacier tunnel - Photographs of tunnel excavation - Video of tunnel excavation Further details are provided at: Fitzsimons, S., Samyn, D., & Lorrain, R (2024). Deformation, strength and tectonic evolution of basal ice in Taylor Glacier, Antarctica. Journal of Geophysical Research: Earth Surface, 129, e2023JF007456. https://doi.org/10.1029/2023JF007456 GET DATA: https://doi.org/10.5281/zenodo.8232003
-
Raw images (over approximately 20.000 unique images) collected during the Adelie Penguin Census across 30+ colonies since 1981 (see associated metadata resource for list full list of colonies). Photographs were taken using a black and white film camera from 1981 to 2004 (inclusive) and 2008. Images are available in .tif fomrat. Images are digital from 2005 onwards (except 2008). Raw images are available in cr2/cr3 formats, and processed images are available across tif and jpg formats. High resolution scanning was initiated in 2011 to scan all the negatives in the collection. There are approximately 10,000 negatives in the collection. Images are taken from helicopter at between 2000-2500 feet. All images collected during the 2324 season are georeferenced with latitude and longitude positions in decimal degrees (WGS 84). Camera Settings: ISO = 400 Shutter speed = greater than 1/1000 Focus = manual, pre-focus to 800m Lens = 135mm with UV filter Aperture/ Exposure = F8 (or up to F11) Image Size = Full size White Balance Setting = Daylight Captures per minute = ~80 GET DATA: m.meredyth-young@antarcticanz.govt.nz
-

Data includes estimates of abundance of seaweed taxa on the seafloor across the Northern Victoria Land coast, Ross Sea, Antarctica. This includes: - Metadata of video transects - Seaweed density across transects - Modelled outputs of light attenuation across sites. Descriptions: - "Antarctic_Seaweed_Metadata_TAN2101_TAN2302_Dryad.xlsx" - Metadata of video transects, date and time, locations, gear, depth, distance covered. - "Antarctic_Seaweeds_TAN2101_TAN2302.csv" - Density of seaweed functional groups across video transects - "Light_transects_TAN2021_TAN2302.csv" - Outputs of light modelling for seafloor regions of the Ross Sea - "Antarctic_Seaweed_RScript_Tait_etal_2024.txt" - R sripts used to plot, analyse and model the above datasets Further details are provided at: Tait, L.W., Chin, C., Nelson, W. et al. Deep-living and diverse Antarctic seaweeds as potentially important contributors to global carbon fixation. Commun Earth Environ 5, 205 (2024). https://doi.org/10.1038/s43247-024-01362-2 GET DATA: https://doi.org/10.5061/dryad.w6m905qwz
-
This work was primarily funded by the NASA-funded RISE-UP: Ross Ice Shelf & Europa Underwater Probe (PI Britney E. Schmidt) project. Field work at the KIS-1 site during the 2019-2020 season was completed through international collaboration between NASA, NSF/USAP, and Antarctica New Zealand, funded by the Aotearoa New Zealand Antarctic Science Platform (ANTA1801) Antarctic Ice Dynamics Project (ASP02101), and the NZARI-funded Aotearoa New Zealand Ross Ice Shelf Programme, “Vulnerability of the Ross Ice Shelf in a Warming World” (grant no. 2014-11). The data contained in this directory are merged and calibrated data files from three missions conducted with ROV Icefin through a borehole drilled through Ross Ice Shelf at KIS1 (-82.78410, -155.26267), near the Kamb Ice Stream grounding zone. Missions were conducted in 2019 on December 16th, 18th, and 21st (UTC). For questions or assistance working with the data please contact Britney Schmidt (britneys@cornell.edu) and Justin Lawrence (jdl287@cornell.edu). Related Publication: https://doi.org/10.1038/s41561-023-01129-y GET DATA: https://doi.org/10.15784/601625
-

Contained in this folder are the raw and processed data files for data collected with the underwater robot Icefin in the ocean cavity beneath Ross Ice Shelf, near the grounding line of Kamb Ice Stream. Most of these data are located within a basal crevasse. They were collected in December 2019 as part of the Aotearoa New Zealand Antarctic Science Platform and Victoria University of Wellington Hot Water Drilling initiative, and the NASA RISEUP grant (NNX16AL07G, PI B. E. Schmidt). The code that converted raw data files to processed can be found at https://zenodo.org/record/8338529. Direct questions to Peter Washam at pwasham@cornell.edu. RELATED PUBLICATION: https://doi.org/10.1126/sciadv.adi7638 GET DATA: https://doi.org/10.15784/601733