 GeoData.NZ
Biota
Type of resources
Available actions
Topics
Keywords
Contact for the resource
Provided by
Years
Formats
Representation types
Update frequencies
status
Resolution
-
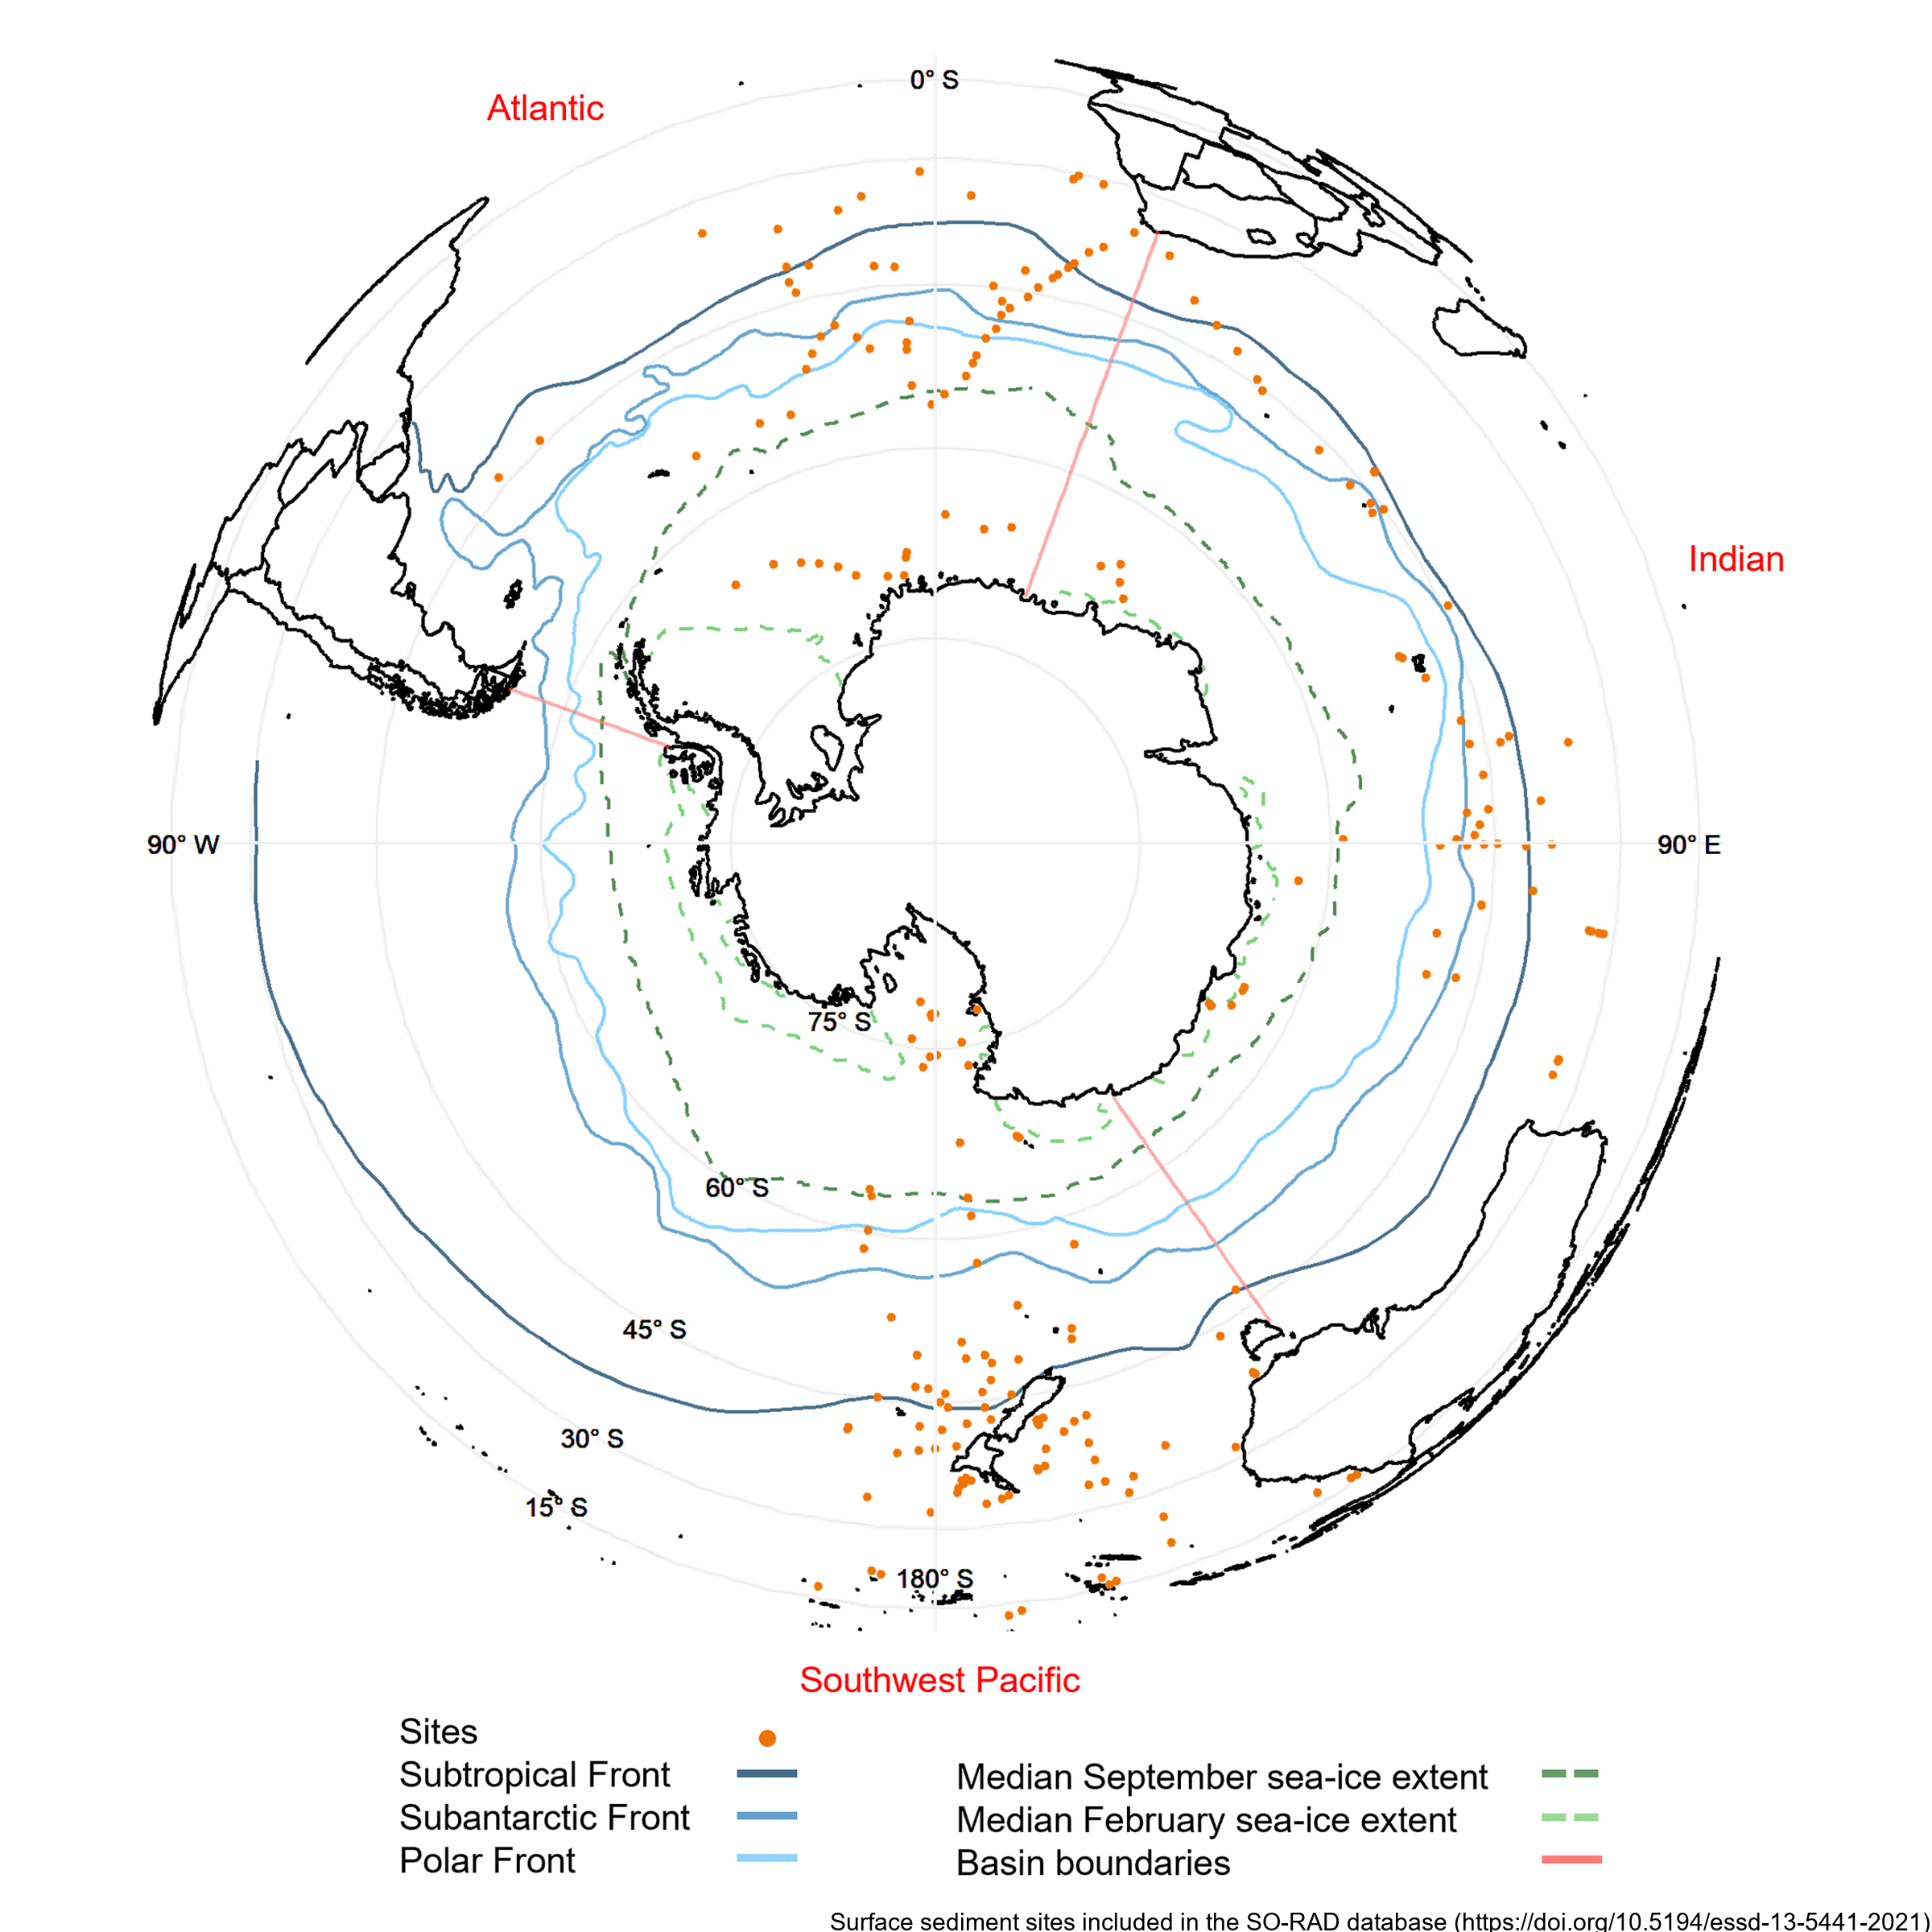
Radiolarians (holoplanktonic Protozoa) found in marine sediments are commonly used in Southern Ocean as palaeoclimate proxies. Generating such reconstructions of past climate based on radiolarian abundances requires a spatially and environmentally comprehensive reference dataset of modern radiolarian census counts. The Southern Ocean RADiolarian (SO-RAD) dataset includes census counts for 237 radiolarian taxa from 228 surface sediment samples located in the Atlantic, Indian and South-west Pacific sectors of the Southern Ocean. This compilation is the largest radiolarian census dataset derived from surface sediment samples in the Southern Ocean. The SO-RAD dataset may be used as a reference dataset for palaeoceanographic reconstructions, or for studying modern radiolarian biogeography and species diversity. RELATED PUBLICATION: https://doi.org/10.5194/essd-13-5441-2021
-
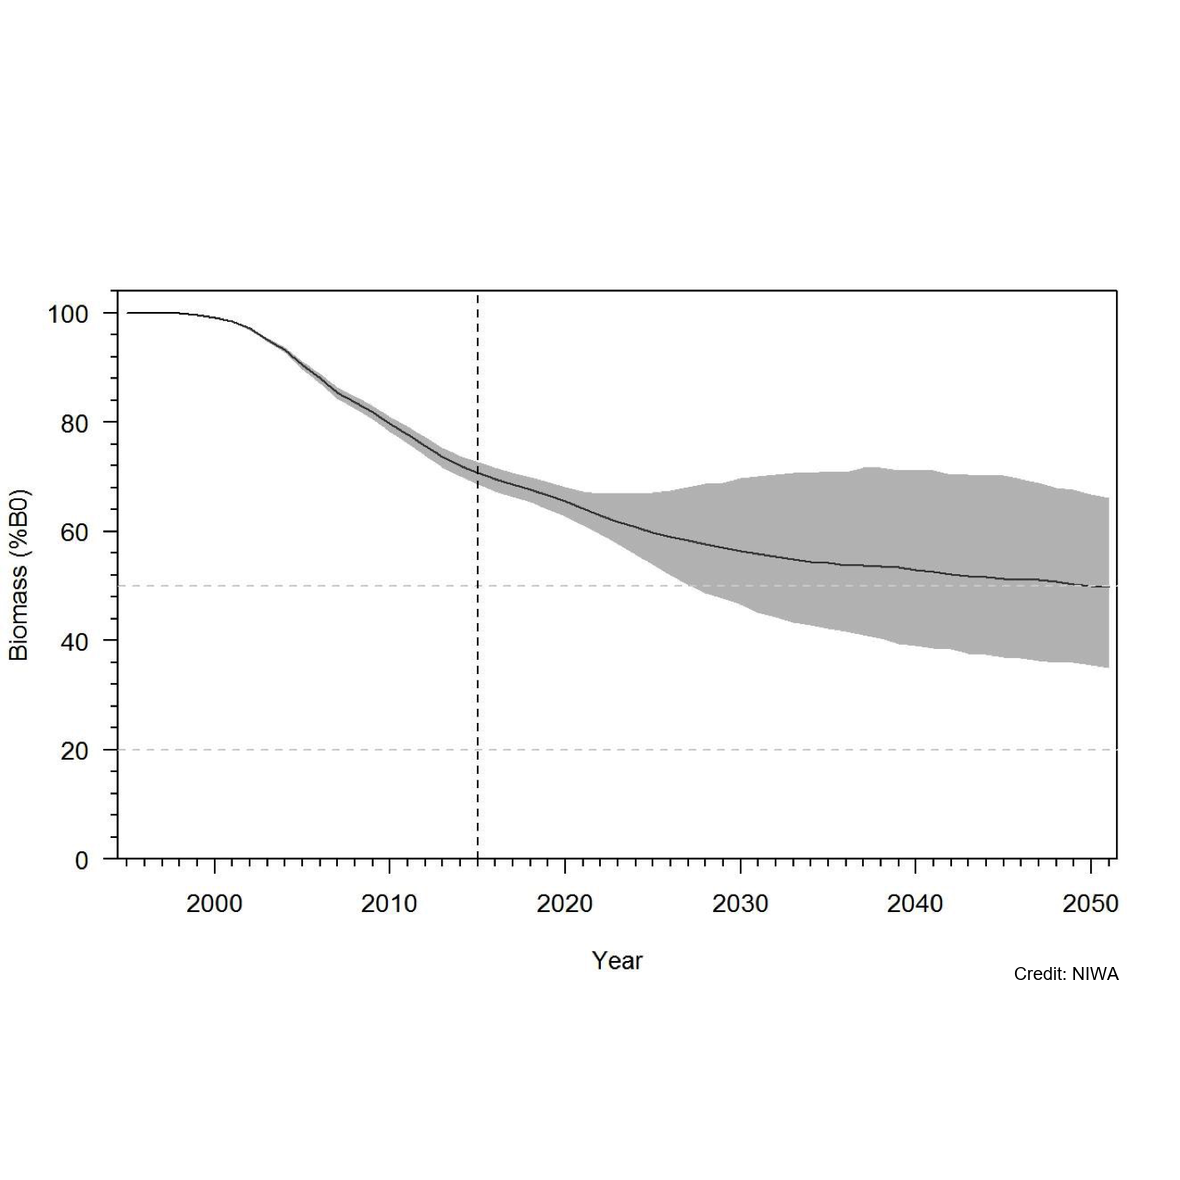
Knowledge of recruitment dynamics, and in particular trends in recruitment and recruitment variability, are key inputs for integrated assessments of fish stocks. A quantitative longline survey monitoring the recruitment of Antarctic toothfish (Dissotichus mawsoni) in the southern Ross Sea was started in 2012. The survey was expanded in 2016 to monitor trends and biological characteristics in two areas of importance to predators, Terra Nova Bay and McMurdo Sound, and to collect data that would contribute to the research and monitoring plan for the Ross Sea region Marine Protected Area. In most years, the survey was completed as planned, while in three years several factors have constrained the survey from sampling all stations and in the latest two seasons pandemic travel restrictions have necessitated an alternative delivery approach. Between 2012 and 2022, 2 056 tagged Antarctic toothfish have been released on the survey and 21 toothfish have been recaptured. Fifteen pop-up satellite archival tags (PSATs) were deployed on D. mawsoni in 2019 and fifteen skates were tagged in 2020 and 2021. Many tagged toothfish released from the RSSS move from the shelf to the slope. Trends in abundance indices and size and age composition consistently show the progression of strong year classes entering and leaving the survey area and have indicated that recruitment is likely more variable than previously thought. Data from the RSSS have been used to indicate year class strength in Antarctic toothfish stock assessments since 2015. The twelve surveys to date have resulted in a substantive increase in the knowledge and understanding of the distribution and relative abundance of a range of demersal fish species and invertebrate taxa caught on the longlines. Other data routinely collected on the surveys were plankton, temperature, salinity, air quality, cetacean and other marine mammal observations, and photo, video, and echosounder data. The RSSS has provided synergies with other research programmes also addressing CCAMLR objectives, particularly those focused on research and monitoring within the RSrMPA. GET DATA: https://www.ccamlr.org/en/publications/statistical-bulletin
-

Using seafloor image data to build single-taxon and community distribution models for seabed fauna in New Zealand waters. Understanding the spatial distributions of seabed biodiversity is essential for effective management of the effects of human activities including fishing and mining. To improve understanding of seabed fauna distributions, we are developing a new database of benthic invertebrate occurrences in New Zealand waters by assembling quantitative data from all available seabed photographic surveys. By modelling the spatial relationships between taxon occurrences and environmental gradients across the region, we are able to predict the likelihood of individual taxa and communities being present in as-yet unsampled areas. In the first phase of the project, we concentrated on Chatham Rise; a region of high importance to commercial fisheries and with the highest density of available seabed imagery. Predictions from the models developed here are the first abundance-based models of benthic distributions in the New Zealand region and are the best-informed representations of seabed distributions on Chatham Rise to date, providing a resource that will have applications in marine environmental management and ecosystem research. All rasters are in a geotiff format at a 1000 m resolution cell size and projected to WGS 84 / Mercator 41 - EPSG:3994 coordinate system.
-

Using seafloor image data to build single-taxon and community distribution models for seabed fauna in New Zealand waters. Understanding the spatial distributions of seabed biodiversity is essential for effective management of the effects of human activities. However, existing knowledge of seabed faunal distributions comes overwhelmingly from records of museum specimens and fisheries and research trawl bycatch. Data from such sources have been used to build models that predict species and community distributions on the basis of correlations with environmental gradients but because these models are based on presence-only data from disparate sources and times, their predictions are considered uncertain. To improve understanding of seabed fauna distributions around New Zealand, we are developing a new database of occurrences and population densities based entirely on quantitative data from seabed photographic surveys designed to sample these fauna. By modelling the spatial relationships between taxon occurrences and environmental gradients across the region, we are able to predict the likelihood of individual taxa and communities being present in as-yet unsampled areas. In the first phase of the project, we concentrated on Chatham Rise; a region of high importance to commercial fisheries and with the highest density of existing seabed imagery. The models developed here were the first abundance-based models of benthic distributions in the New Zealand region at these spatial scales. In the second phase, we expanded the domain of the predictive models to encompass Campbell Plateau, in the south-eastern sector the EEZ. Combining data from Chatham Rise and Campbell Plateau in a single dataset of benthic invertebrate taxon occurrences and population densities enabled development of up-dated predictive distribution models for a range of individual invertebrate taxa, as well as models of the spatial variability in overall community composition. Rasters are in a geotiff format at a 1000 m resolution cell size and have their relevant projections written in their files.
-

This metadata record represents the R phytoclass package. Determine the chlorophyll a (Chl a) biomass of different phytoplankton groups based on their pigment biomarkers. The method uses non-negative matrix factorisation and simulated annealing to minimise error between the observed and estimated values of pigment concentrations (Hayward et al. (2023) https://doi.org/10.1002/lom3.10541). The approach is similar to the widely used 'CHEMTAX' program (Mackey et al. 1996) https://doi.org/10.3354/meps144265), but is more straightforward, accurate, and not reliant on initial guesses for the pigment to Chl a ratios for each phytoplankton group. Further details are provided at: Hayward, A., M. H. Pinkerton, and A. Gutierrez-Rodriguez. 2023. phytoclass: A pigment-based chemotaxonomic method to determine the biomass of phytoplankton classes. Limnol. Oceanogr. Methods 21: 220–241. https://doi.org/10.1002/lom3.10541 GET PACKAGE: https://cran.r-project.org/web/packages/phytoclass/readme/README.html
-

The landmark 518-page publication "Cenozoic Mollusca of New Zealand" by Beu & Maxwell (1990, NZGS Paleontological Bulletin 58) is long out of print. This publication by Beu & Raine (2009, GNS Science Miscellaneous Publication 27) contains revised descriptions and names of all species treated in detail in Paleontological Bulletin 58, arranged in a hypertext format. This guide has been constructed from the text of NZGS Paleontological Bulletin 58, with the figures individually scanned and available alongside the relevant text. Minor changes have been made to the text of morphological descriptions and notes about distribution, but the names of taxa and comparison notes have been extensively updated with taxonomic changes that have been published on Mollusca during the intervening 20 years. DOI:https://doi.org/10.21420/P5FX-VE20 Cite as: Beu, A. G., & Raine, I. J. (2009). Revised descriptions of New Zealand Cenozoic Mollusca from Beu and Maxwell (1990). GNS Science. https://doi.org/10.21420/P5FX-VE20
-
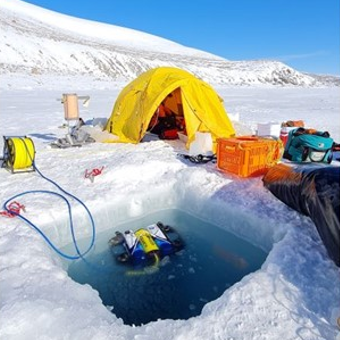
This metadata record represents environmental DNA sequence data and metadata barcode file. Seawater and sponge eDNA metabarcoding sampling was conducted at seven coastal locations (Cape Barne, Cape Evans, Cziko Seamount, Granite Harbor Middle, Granite Harbor South, and Turtle Rock) in the Ross Sea to assess spatial eukaryote biodiversity patterns and investigate eDNA signal differences between both substrates. Five replicate 500 mL water samples were collected at each of seven locations within 2 m of the ocean floor using a Niskin bottle. At the same time, five sponge specimens were collected by ROV at a depth range of 18–30 m from three out of the seven locations, thereby enabling sponge and near-bottom water eDNA signal comparison. Further details and laboratory procedures can be found in https://doi.org/10.1002/edn3.500 GET DATA: https://figshare.com/projects/Unveiling_the_Hidden_Diversity_of_Marine_Eukaryotes_in_the_Ross_Sea_A_Comparative_Analysis_of_Seawater_and_Sponge_eDNA_Surveys/186127
-

Plot data Mc Nemar: To enable comparisons with the 1961 and 2004 survey results, the Lambert Conformal Conic projection from the 2004 survey was used to precisely georeference and trim the RGB image across a 1-m2 grid, generating a total of 3,458 1-m2 grid cells. For each grid cell moss, lichen, or algae/cyanobacteria cover was extracted as one of the four cover classes: Heavy (>40%), Patchy (10–40%), Scattered (less than 10%), and None (0%) for the survey years 1962, 2004 and 2018. Ground truthing: To test the overall accuracy of cover classifications and ensure consistency with 2004 survey methodologies, a ground-truthing approach was performed. Photographs were taken of individual cells along eight transects, running west to east across the plot at 0.5, 1.5, 15.5, 16.5, 28.5, 29.5, 116.5 and 117.5 m distance from the NW corner. Each grid cell could be identified individually with an x/y coordinate in the centre and was surrounded by a rectangular frame parallel to the outer edge of the plot. A total of 174 photographs were taken and archived with Antarctica New Zealand. For each photographed grid cell, the presence of each functional group of vegetation and their cover class was assessed visually. Orthomosaic image: Aerial images were obtained using a DJI Matrice 600 Pro hex-rotor remotely piloted aircraft system equipped with a Canon EOS 5Ds camera (image size: 8688×5792 pixels, focal length: 50 mm, pixel size: 4.14 μm) on November 28, 2018. The flight altitude was 30 m above ground level, and a total of 10 ground-control points were included to provide accurate geo-referencing. An orthomosaic photo and accompanying DEM was generated with the acquired aerial images using Agisoft PhotoScan (now known as Metashape by Agisoft LLC, https://www.agisoft.com/) RELATED PUBLICATION: https://doi.org/10.1029/2022EF002823 GET DATA: https://doi.org/10.7488/ds/3417
-
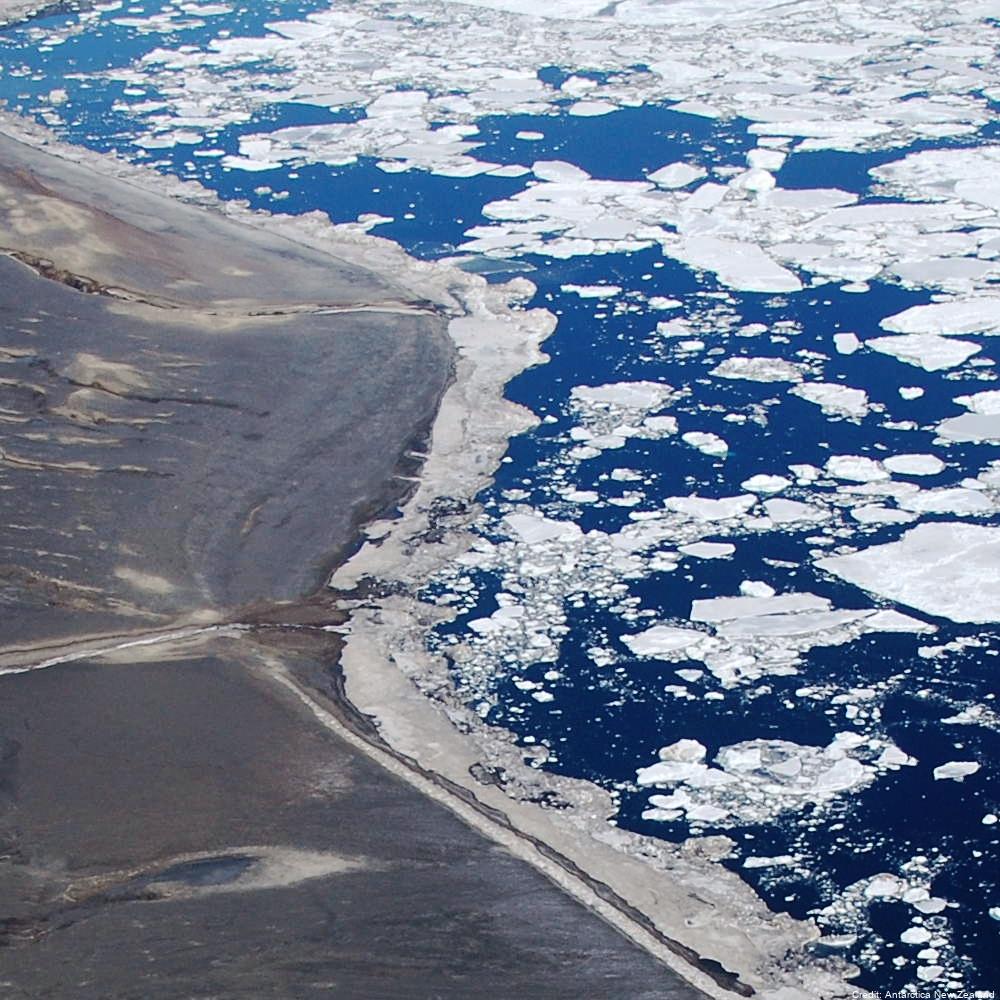
Aerial reconnaissance and photography are used in the Ross Sea sector of Antarctica to determine the breeding locations of Adélie penguins and to count the numbers of nests occupied during the early incubation period. From 1981 to present (two-year embargo), all islands and sea coasts between 158°E and 175°E have been searched, and 11 previously unreported breeding colonies discovered. The aim is to census Adélie (Pygoscelis adeliae) populations to provide basic data against which future population levels can be compared in order to monitor environmental change of the Antarctic Ocean ecosystem, both natural and man-induced. GET DATA: https://datastore.landcareresearch.co.nz/en_AU/dataset/adelie-penguin-census-data
-
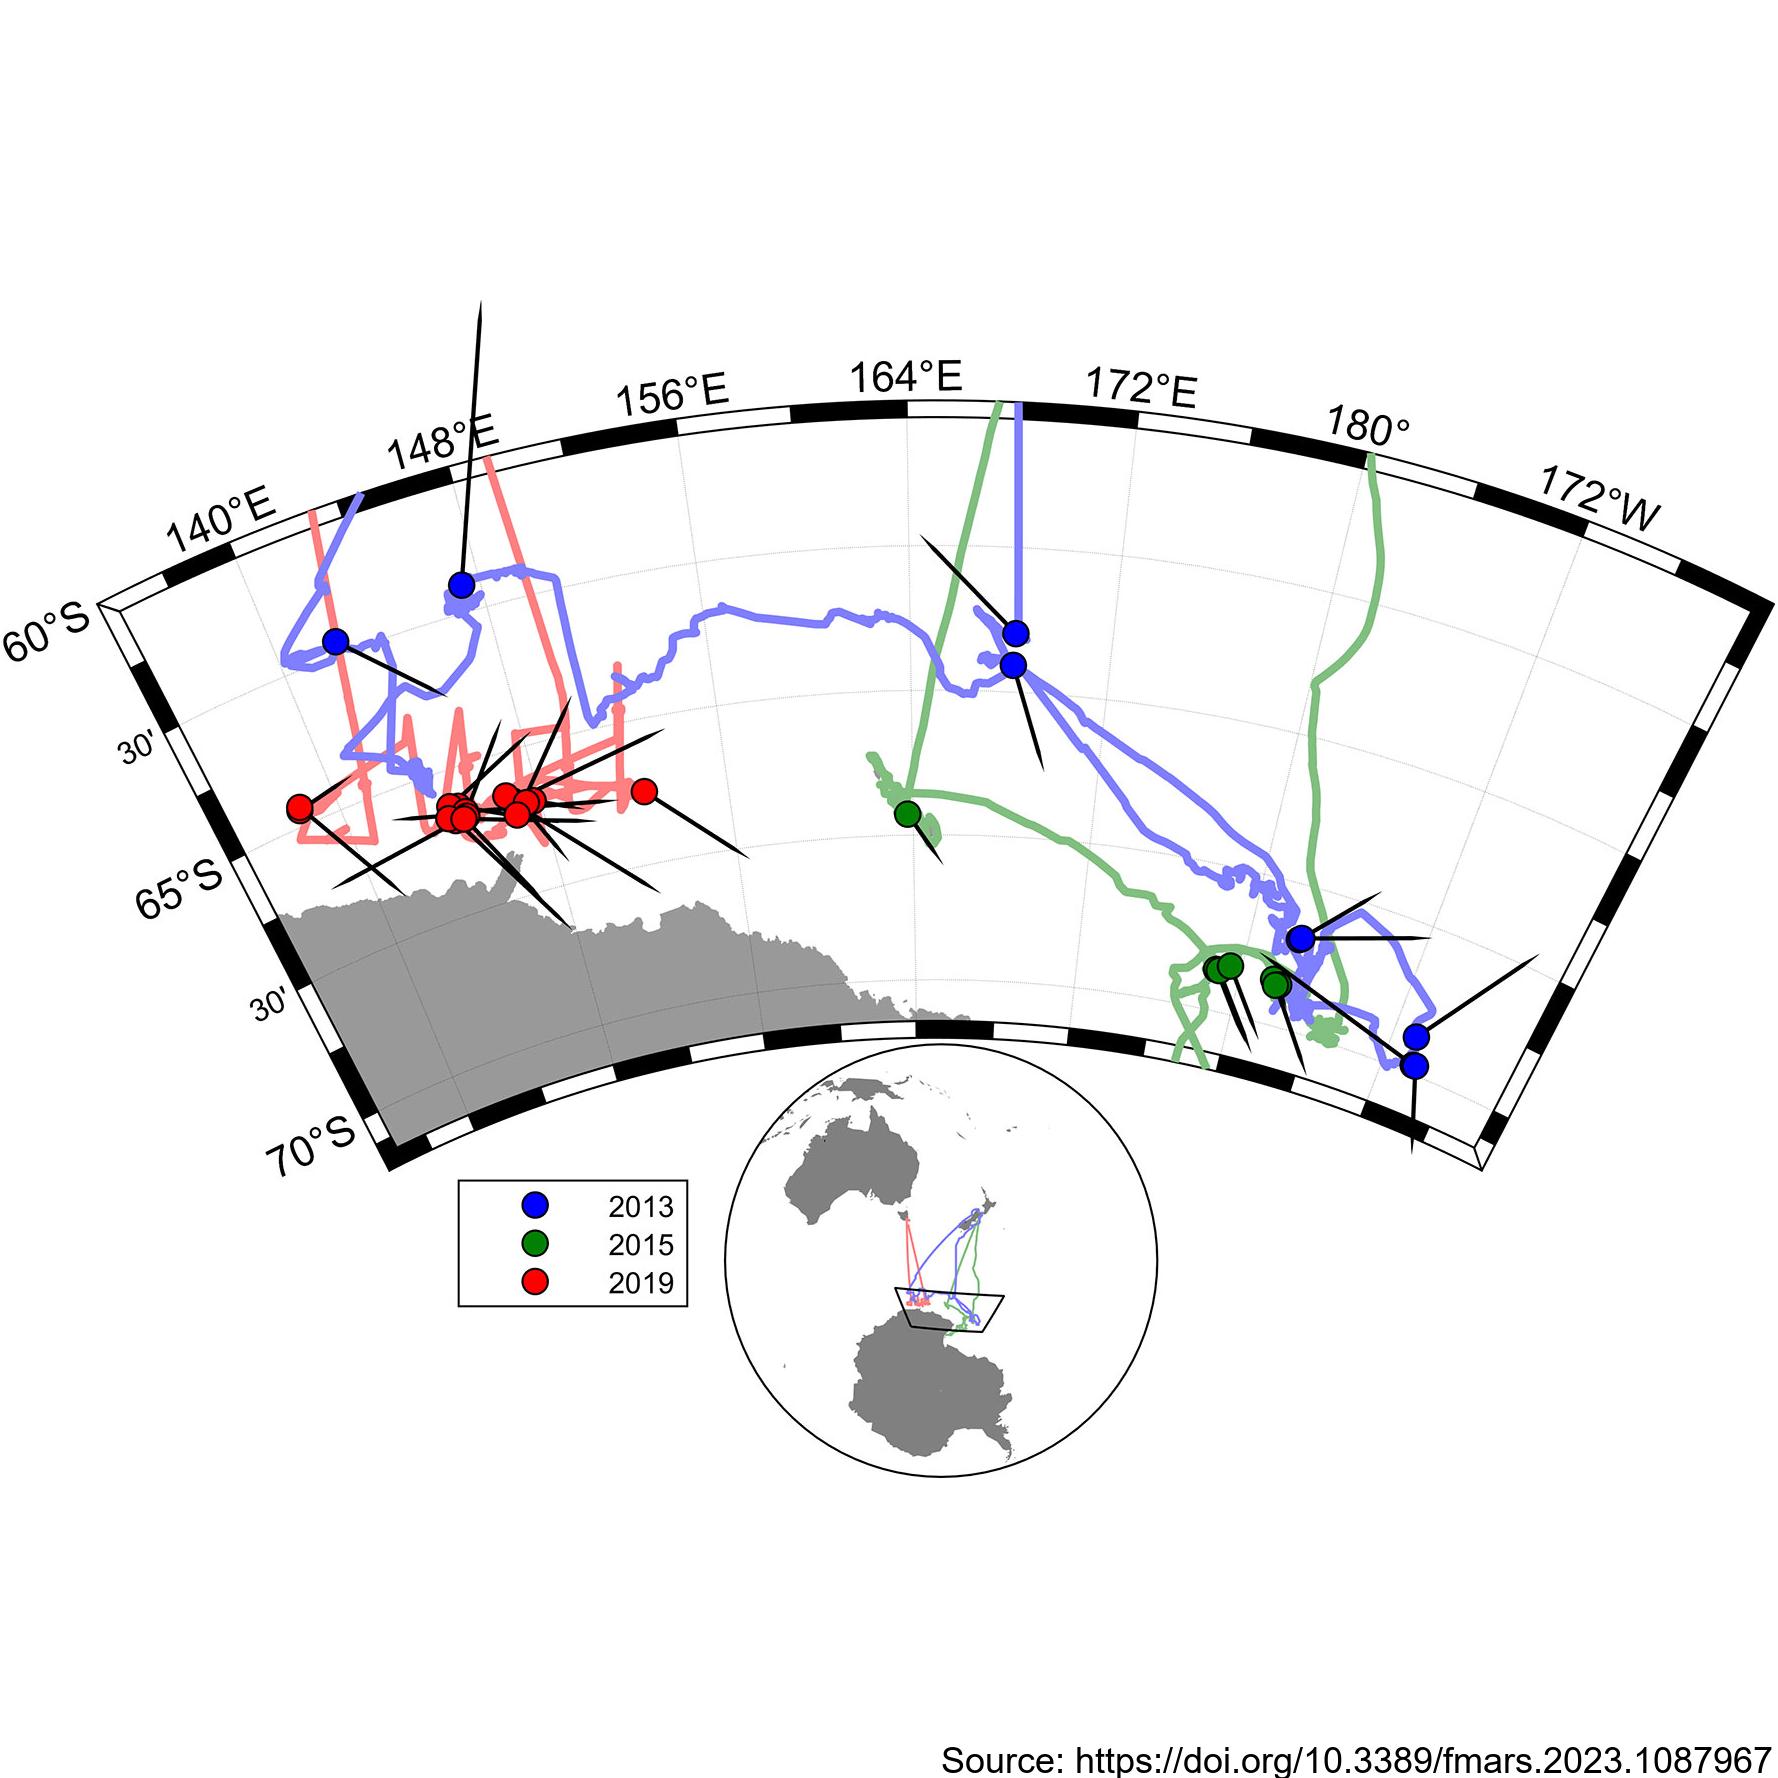
During the 2019 ENRICH Voyage of the CSIRO vessel, RV Investigator, a digital photogrammetric video tracking system was used to collect precise surfacing locations during encounters with mainly Antarctic blue whales, but also some fin whales. The photogrammetric video tracking system is a modern digital video version based on the same operating principle as the that described by Leaper and Gordon 2001, and enables determination of the range and bearing to tracked objects relative to the ship. Video tracking was conducted on 24 occasions for a total of 18 hours. Focal follows were aborted when it was no longer possible to follow the focal animal due to ice or when the presence of other animals meant it was no longer possible to be sure which was the focal animal. Calderan SV, Leaper R, Andrews-Goff V, Miller BS, Olson PA, Reyes MVR, Bell E and Double MC (2023) Surfacing rates, swim speeds, and patterns of movement of Antarctic blue whales. Front. Mar. Sci. 10:1087967. https://doi.org/10.3389/fmars.2023.1087967 GET DATA: https://doi.org/10.26179/tcbe-4h63