 GeoData.NZ
oceans
Type of resources
Available actions
Topics
Keywords
Contact for the resource
Provided by
Years
Formats
Representation types
Update frequencies
status
Scale
Resolution
-
This set is a compilation of raster imagery at various scales. All data contained is available for download from the LINZ Data Service. THIS DATA DOES NOT REPLACE NAUTICAL CHARTS AND MUST NOT BE USED FOR NAVIGATION. Note: This set contains charts at a variety of scales. Use of LDS web map tile services for this set is not recommended as the scaled charts overlap. The hydrographic raster data made available through the LINZ Data Service is based on the Paper Navigational Charts published and maintained by the New Zealand Hydrographic Authority at Land Information New Zealand (LINZ). The online New Zealand Chart Catalogue provides more detailed and the most up to date information about New Zealand charts: [New Zealand Chart Catalogue] (http://www.linz.govt.nz/sea/charts/paper-charts/nz202-chart-catalogue). Information on symbols and abbreviations used on nautical charts: [Symbols and Abbreviations] (http://www.linz.govt.nz/sea/charts/paper-charts/symbols-terms-abbreviations-used-charts). Hydrographic standards and specifications for nautical charts and publications: [Standards and Specifications] (http://www.linz.govt.nz/sea/charts/hydrographic-standards-technical-specifications).
-
Contained in this folder are the raw and processed data files for data collected with the underwater robot Icefin in the ocean cavity beneath Ross Ice Shelf, near the grounding line of Kamb Ice Stream. Most of these data are located within a basal crevasse. They were collected in December 2019 as part of the Aotearoa New Zealand Antarctic Science Platform and Victoria University of Wellington Hot Water Drilling initiative, and the NASA RISEUP grant (NNX16AL07G, PI B. E. Schmidt). The code that converted raw data files to processed can be found at https://zenodo.org/record/8338529. Direct questions to Peter Washam at pwasham@cornell.edu. RELATED PUBLICATION: https://doi.org/10.1126/sciadv.adi7638 GET DATA: https://doi.org/10.15784/601733
-
Here we present physico-chemical data collected during two research cruises conducted to and across the Ross Sea, Antarctica in the summer of 2018 (February-March) and 2019 (January-February). The dataset includes measurements of temperature, salinity, oxygen, par and transmissivity obtained with a Sea-Bird Electronics (SBE) 911plus CTD. The CTD sensor was configured with SBE 3plus, SBE 4, and SBE 43 dual sensors for the parameters above, in addition to a seapoint fluorescence sensor, and a photosynthetically active radiation (PAR) sensor (Biospherical Instruments QCP‐2300L‐HP). These data were used to provide oceanographic context to DNA metabarcoding analysis of 18S rRNA V4 region that was carried out on DNA samples collected in parallel to nutrient and chlorophyll-a samples. Fastq samples from DNA metabarcoding analysis and the associated metadata (including nutrients, Chlorophyll-a, and size-fractionated chlorophyll-a) were deposited to GenBank under project numbers PRJNA756172 (2018 cruise) and PRJNA974160 (2019 cruise). The study resulting from this analysis has been submitted to Limnology and Oceanography. RELATED PUBLICATION: Cristi, A., Law, C.S., Pinkerton, M., Lopes dos Santos, A., Safi, K. and Gutiérrez-Rodríguez, A. (2024). Environmental driving forces and phytoplankton diversity across the Ross Sea region during a summer–autumn transition. Limnol Oceanogr. https://doi.org/10.1002/lno.12526
-
The Southern Ocean Freshwater Input from Antarctica (SOFIA) Initiative aims to improve our understanding of the simulated response to Antarctic freshwater input, and in particular the model uncertainty. The initiative has developed an experimental protocol and is engaging with modelling groups from around the world to run this common set of experiments using a variety of coupled climate and ocean-only models. Data from this international multi-model ensemble is openly shared for analysis, and is being synthesized into a series of publications by SOFIA participants. Full details are provided at https://doi.org/10.5194/gmd-16-7289-2023 GET DATA: https://sofiamip.github.io/data-access.html
-
Here, we present drill hole measurements carried out at 14 field sites distributed over a ~1500 km^2 area of fast ice in the south of McMurdo Sound, Antarctica between 1 and 19 November 2018. At each site, five holes were drilled in the fast ice at the centre and end points of two cross‐profile lines, each 30 metre long. Sea ice and SIPL thicknesses were measured with a suspended thickness probe and metal bar using the procedure described in Price et al. (2014). Snow depth measurements at centimetre accuracy were made at half‐metre intervals along the cross‐profiles using a metal ruler or a GPS‐equipped Magnaprobe. Sea ice freeboard (i.e., the height of the sea ice surface above sea level) was measured in each of the drill holes. The average value for each parameter was calculated at each field site to provide a representative measurement over the 30 metre cross-profile fast ice area. The drill hole measurements were used to underpin spatial distribution surveys of the aforementioned parameters, to inform electromagnetic induction forward and inverse models, and to ground-validate satellite altimetry assessments of fast ice freeboard and derived ice thickness in McMurdo Sound.
-
This layer contains depth information in gridded format captured by multibeam sonar in 2020 as part of HS71 - Coromandel. The data was collected for Toitū Te Whenua Land Information New Zealand (LINZ) and for which the survey took place from 19 October to 9 November 2020. Data management and distribution is by LINZ. Data comprises a gridded depth model as tif or ascii tiles in UTM projection. Vertical accuracy is +/- 0.511m (95%) Horizontal accuracy is +/- 2m (95%) Vertical datum is Approximate Lowest Astronomical Tide. The source data used to create the depth model may be of a higher resolution/density than the model. This data can be supplied on request and available resolutions be discovered through the [NZ Bathymetric Surface model Index](https://data.linz.govt.nz/layer/95574-nz-bathymetric-surface-model-index/).
-
This set is a compilation of raster imagery at various scales. All data contained is available for download from the LINZ Data Service. THIS DATA DOES NOT REPLACE NAUTICAL CHARTS AND MUST NOT BE USED FOR NAVIGATION. Note: This set contains charts at a variety of scales. Use of LDS web map tile services for this set is not recommended as the scaled charts overlap. The hydrographic raster data made available through the LINZ Data Service is based on the Paper Navigational Charts published and maintained by the New Zealand Hydrographic Authority at Land Information New Zealand (LINZ). The online New Zealand Chart Catalogue provides more detailed and the most up to date information about New Zealand charts: [New Zealand Chart Catalogue] (http://www.linz.govt.nz/sea/charts/paper-charts/nz202-chart-catalogue). Information on symbols and abbreviations used on nautical charts: [Symbols and Abbreviations] (http://www.linz.govt.nz/sea/charts/paper-charts/symbols-terms-abbreviations-used-charts). Hydrographic standards and specifications for nautical charts and publications: [Standards and Specifications] (http://www.linz.govt.nz/sea/charts/hydrographic-standards-technical-specifications).
-
This dataset provides the boundary of New Zealand’s continental shelf, which is the area of seabed around a large land mass where the sea is relatively shallow compared with the open ocean. The continental shelf is the seabed and subsoil of the submarine areas that extend beyond the territorial sea of a coastal state throughout the natural prolongation of its land territory to the outer edge of the continental margin. In New Zealand’s case, the continental margin extends beyond the Exclusive Economic Zone in many places and the outer limits have been established on the basis of the recommendations of the United Nations Commission on the Limits of the Continental Shelf. Under UNCLOS, New Zealand exercises sovereign rights over the continental shelf for the purpose of exploring it and exploiting its natural resources. Note: The boundary includes, where applicable, the delimitation of the boundaries of the continental shelf with Australia under the treaty of 25 July 2004. The delimitation of the maritime boundaries in the north with Fiji, Tonga and possibly France in respect of New Caledonia, have yet to be settled by treaty. Maritime Boundary Definitions: http://www.linz.govt.nz/hydro/nautical-info/maritime-boundaries/definitions#zones Further References: http://www.linz.govt.nz/hydro/nautical-info/maritime-boundaries
-
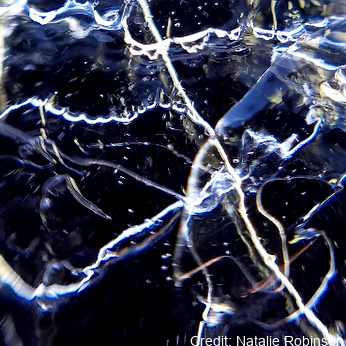
Here we provide data from the Ross Ice Shelf ocean cavity. The HWD2 Camp was established in October of 2017 at (-80 39.497, 174 27.678) where the ice is moving seaward at around ~600 m a-1 and is sourced from the Transantarctic Mountains. Profiling Instruments - Profiling was primarily conducted with an RBR Concerto CTD (conductivity-temperature depth) profiling instrument, and this was cross-calibrated against irregular profiles with an RBR Duet (pressure and temperature only), a SBE37 MicroCat CTD as well as moored SBE37 MicroCat CTDs. The RBR unit is small and has suitable sensor capability (temperature and conductivity accuracies of ±0.002°C and ±0.003 mS cm-1). Its conductivity cell design is not prone to fouling by ice crystals, making it ideal for work in the sometimes crystal-laden borehole conditions. We were inconsistent in how we mounted the CTD on its protective frame and this appeared to make small difference in the conductivity signal (resulting in an ~0.03 psu variation). This was post-corrected based on the essentially invariant mooring data from the lower water column as well as SBE37 cross-calibration profile data. Because of the potential for sediment contamination of the sensors, the profiles were mostly conservative in their proximity to the sea floor. On several occasions, profiles were conducted all the way to the sea floor. The temperature and salinity are presented in EOS-80 in order to compare with available data. Eighty-three profiles are provided here (ctd_HWD2_*.dat). In addition, limited microstructure profiling was conducted to provide insight into some of the mixing details. The profiles were conducted by lowering the instrument to the ice base then commencing a sequence of three up-down “yo-yos” before returning to the surface and downloading. A data segment is included here (VMP_HWD2.dat). There were some challenges registering the vertical coordinate for the profiles. The melting of the borehole generates a trapped pool of relatively fresh water. The interface between this and the ocean should be near the base of the hole or a little higher – with seawater intrusion. However, there were some instances where the interface was at a higher pressure (i.e. apparently in the open water column). The best explanation for this is that the water in the borehole is not at static equilibrium for some period after initial melting. We use 34.3 psu as a cut-off, in addition to a pressure criterion to identify the top of the useful oceanic profile. It is also not inconceivable that water was being ejected from the hole, but it is unlikely that this would have impacted in the consistent observed pattern. Instrumented Mooring - The mooring instruments at HWD2-A comprised 5 Nortek Aquadopp single point current meters in titanium housings reporting to the surface (30-minute interval, Table SI-Three) via an inductive modem to a Sound-9 data logger and Iridium transmitter. The current meter measurements were corrected to account for the 138° magnetic declination offset (i.e. the south magnetic pole is to the north-west of the field site). Five files are provided here (HWD2_Init_rcm*.dat4). Stevens Craig, Hulbe Christina, Brewer Mike, Stewart Craig, Robinson Natalie, Ohneiser Christian, Jendersie Stefan (2020). Ocean mixing and heat transport processes observed under the Ross Ice Shelf control its basal melting. Proceedings of the National Academy of Sciences, 117 (29), 16799-16804. https://doi.org/10.1073/pnas.1910760117
-

In collaboration between Korea Polar Research Institute LDEO and NIWA, an oceanographic mooring was deployed close to the bottom depth in the Drygalski Basin (lat:-75.010487, lon:165.555680) on 6 March 2018 as a part of the ANA08C research cruise, and it was recovered on 5 January 2019. To monitor physical properties (Temperature, Salinity, Current) of deep water in the Drygalski Basin. GET DATA: https://kpdc.kopri.re.kr/search/992862c1-84d0-46aa-97dd-e2dcfb12357e