 GeoData.NZ
PANGAEA
Type of resources
Available actions
Topics
Keywords
Contact for the resource
Provided by
Years
Update frequencies
status
-
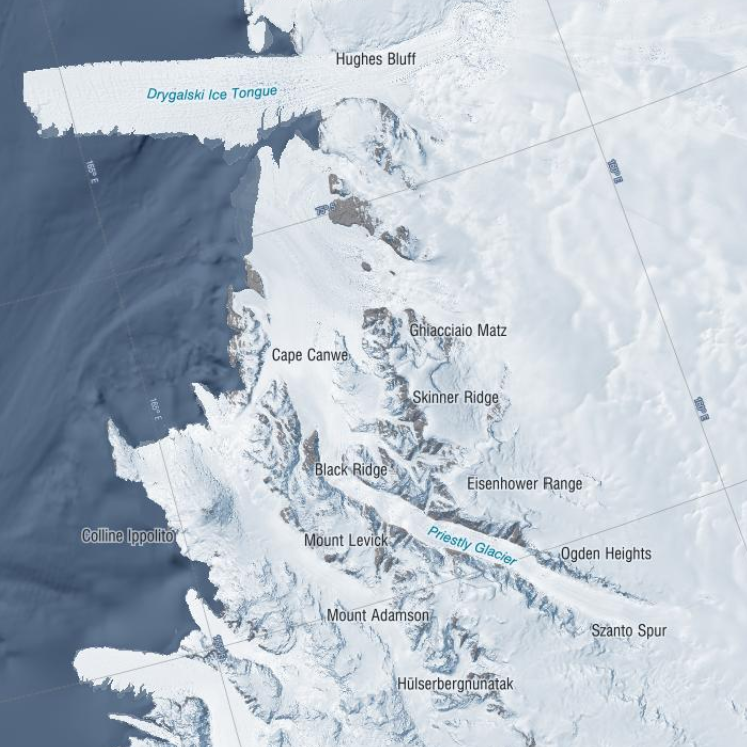
These data were aquired with a Terrestrial Radar Interferometer overlooking the grounding zone of Priestley Glacier, Antarctica. The time series contains differential interferograms with a 12h temporal baseline covering an approximately 8 day period in November 2018. Tidal modulation of ice streams and their adjacent ice shelves is a real-world experiment to understand ice-dynamic processes. We observe the dynamics of Priestley Glacier, Antarctica, using Terrestrial Radar Interferometry (TRI) and GNSS. Ocean tides are predominantly diurnal but horizontal GNSS displacements oscillate also semi-diurnally. The oscillations are strongest in the ice shelf and tidal signatures decay near-linearly in the TRI data over >10 km upstream of the grounding line. Tidal flexing is observed >6 km upstream of the grounding line including cm-scale uplift. Tidal grounding line migration is small and <40 % of the ice thickness. The frequency doubling of horizontal displacements relative to the ocean tides is consistent with variable ice-shelf buttressing demonstrated with a visco-elastic Maxwell model. Taken together, this supports previously hypothesized flexural ice softening in the grounding-zone through tides and offers new observational constraints for the role of ice rheology in ice-shelf buttressing. Related Publication: Drews, R., Wild, C. T., Marsh, O. J., Rack, W., Ehlers, T. A., Neckel, N., & Helm, V. (2021). Grounding-zone flow variability of Priestley Glacier, Antarctica, in a diurnal tidal regime. Geophysical Research Letters, 48, e2021GL093853. https://doi.org/10.1029/2021GL093853 GET DATA: https://doi.org/10.1594/PANGAEA.935707
-

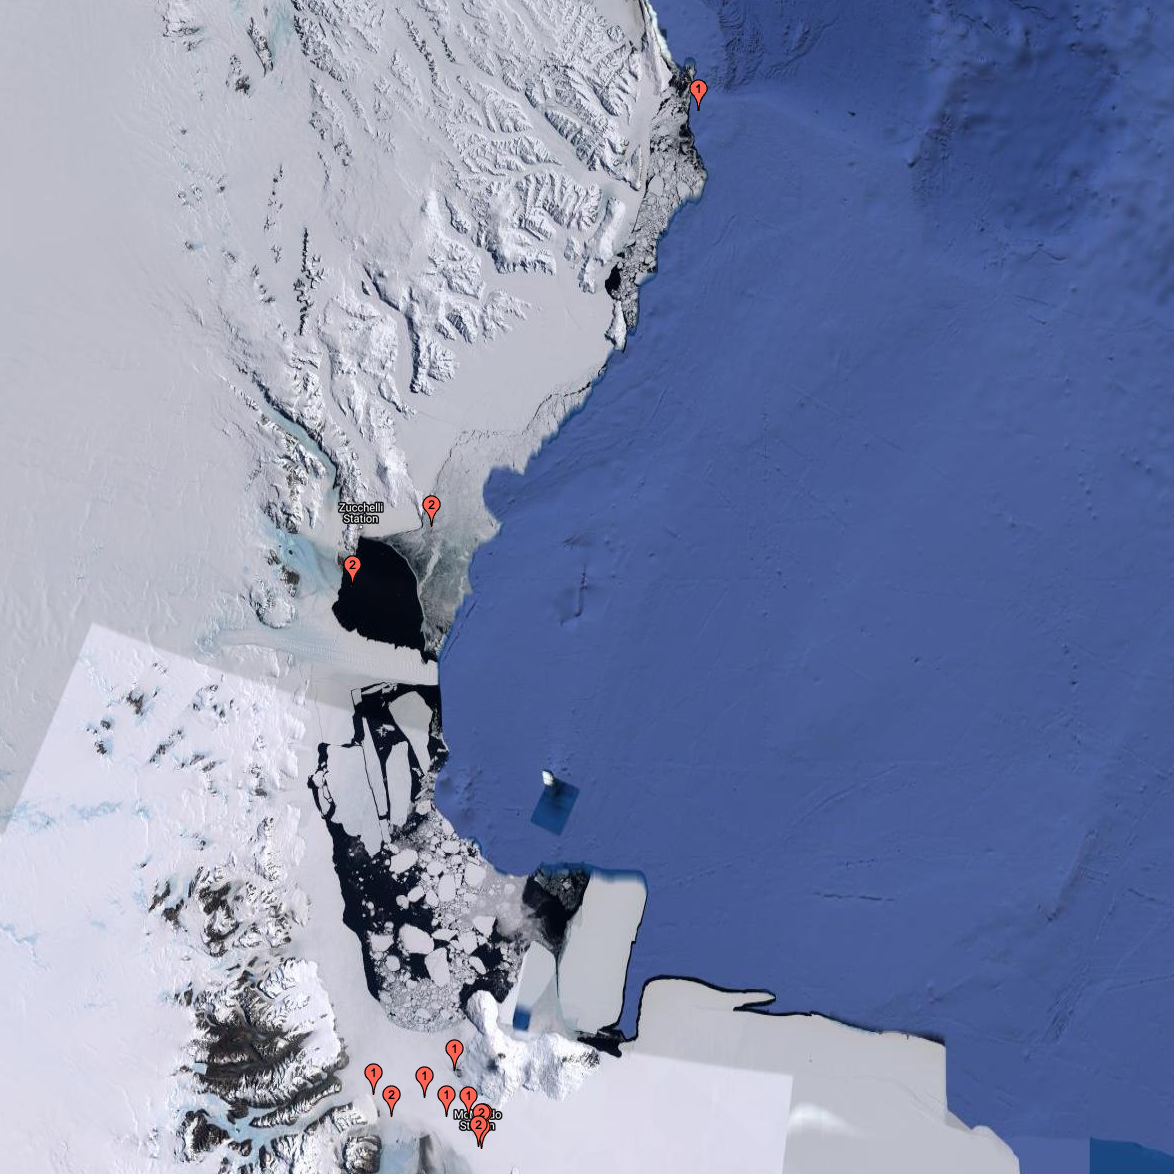
This is GNSS data of four stations covering the grounding zone of Priestley Glacier Antarctica. Tidal modulation of ice streams and their adjacent ice shelves is a real-world experiment to understand ice-dynamic processes. We observe the dynamics of Priestley Glacier, Antarctica, using Terrestrial Radar Interferometry (TRI) and GNSS. Ocean tides are predominantly diurnal but horizontal GNSS displacements oscillate also semi-diurnally. The oscillations are strongest in the ice shelf and tidal signatures decay near-linearly in the TRI data over >10 km upstream of the grounding line. Tidal flexing is observed >6 km upstream of the grounding line including cm-scale uplift. Tidal grounding line migration is small and <40 % of the ice thickness. The frequency doubling of horizontal displacements relative to the ocean tides is consistent with variable ice-shelf buttressing demonstrated with a visco-elastic Maxwell model. Taken together, this supports previously hypothesized flexural ice softening in the grounding-zone through tides and offers new observational constraints for the role of ice rheology in ice-shelf buttressing. Related Publication: Drews, R., Wild, C. T., Marsh, O. J., Rack, W., Ehlers, T. A., Neckel, N., & Helm, V. (2021). Grounding-zone flow variability of Priestley Glacier, Antarctica, in a diurnal tidal regime. Geophysical Research Letters, 48, e2021GL093853. https://doi.org/10.1029/2021GL093853 GET DATA: https://doi.pangaea.de/10.1594/PANGAEA.936090
-
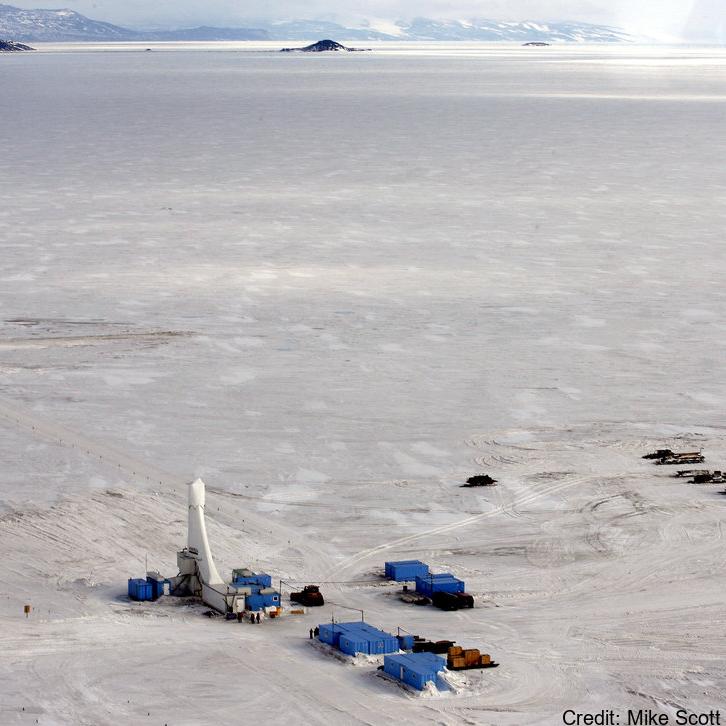
Data of apparent ice thickness from airborne electromagnetic (AEM) surveys of fast ice in McMurdo Sound, Antarctica, carried out in Nov/Dec 2009, 2011, 2013, 2016, and 2017. Values are given for apparent thicknesses derived from both, in-phase and quadrature signals. The difference between both thicknesses is a scaled measure of sub-ice platelet layer thickness. Data are from east-west transects across McMurdo Sound, at fixed latitudes. Data were smoothed and interpolated onto a regular longitude grid (0.001 degree increments). More information can be found in Haas et al. (2021). Related Publication: Haas, C., Langhorne, P. J., Rack, W., Leonard, G. H., Brett, G. M., Price, D., Beckers, J. F., and Gough, A. J.: Airborne mapping of the sub-ice platelet layer under fast ice in McMurdo Sound, Antarctica, The Cryosphere, 15, 247–264, https://doi.org/10.5194/tc-15-247-2021, 2021
-

These data were aquired with a Terrestrial Radar Interferometer overlooking the grounding zone of Priestley Glacier, Antarctica. The time series contains differential interferograms with a 12h temporal baseline covering an approximately 8 day period in November 2018. Tidal modulation of ice streams and their adjacent ice shelves is a real-world experiment to understand ice-dynamic processes. We observe the dynamics of Priestley Glacier, Antarctica, using Terrestrial Radar Interferometry (TRI) and GNSS. Ocean tides are predominantly diurnal but horizontal GNSS displacements oscillate also semi-diurnally. The oscillations are strongest in the ice shelf and tidal signatures decay near-linearly in the TRI data over >10 km upstream of the grounding line. Tidal flexing is observed >6 km upstream of the grounding line including cm-scale uplift. Tidal grounding line migration is small and <40 % of the ice thickness. The frequency doubling of horizontal displacements relative to the ocean tides is consistent with variable ice-shelf buttressing demonstrated with a visco-elastic Maxwell model. Taken together, this supports previously hypothesized flexural ice softening in the grounding-zone through tides and offers new observational constraints for the role of ice rheology in ice-shelf buttressing. Time series of line-of-sight flowfields averaged over approximately three hours. Data were taken with a Terrestrial Radar Interferometer in November 2018 at the grounding zone of Priestley Glacier, Antarctica – The Zip Archive contains 288 Geotiff in South polar stereographic projection – Each raster has 4027 x 4746 entries – The file name details the approximately 3h time inverval of aquisition with Stack_YYYYMMDD_HHMMSS_YYYYMMDD_HHMMSS marking the beginning and end of the time interval, respectively. – The line of sight velocities are given in meters per year Related Publication: Drews, R., Wild, C. T., Marsh, O. J., Rack, W., Ehlers, T. A., Neckel, N., & Helm, V. (2021). Grounding-zone flow variability of Priestley Glacier, Antarctica, in a diurnal tidal regime. Geophysical Research Letters, 48, e2021GL093853. https://doi.org/10.1029/2021GL093853 GET DATA: https://doi.org/10.1594/PANGAEA.935702
-
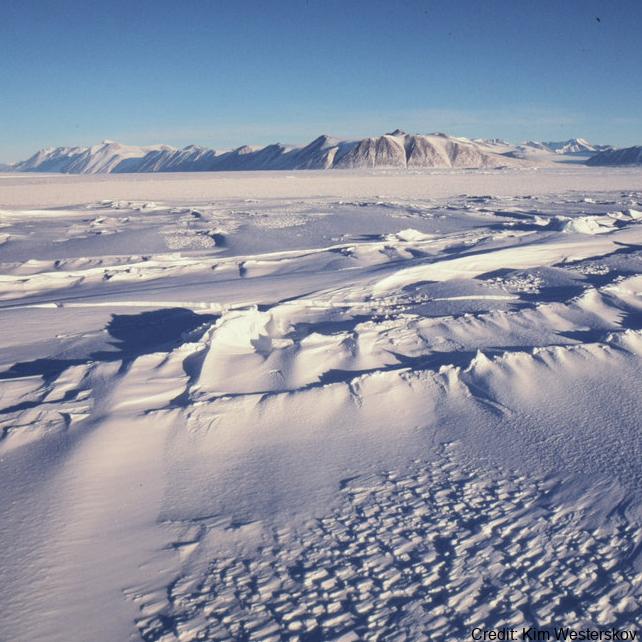
The data are approximately 800 km of airborne electromagnetic survey of coastal sea ice and sub-ice platelet layer (SIPL) thickness distributions in the western Ross Sea, Antarctica, from McMurdo Sound to Cape Adare. Data were collected between 8 and 13 November 2017, within 30 days of the maximum fast ice extent in this region. Approximately 700 km of the transect was over landfast sea ice that had been mechanically attached to the coast for at least 15 days. Most of the ice was first-year sea ice. Unsmoothed in-phase and quadrature components are presented at all locations. Data have been smoothed with an 100 point median filter, and in-phase and quadrature smoothed data are also presented at all locations. Beneath level ice it is possible to identify the thickness of an SIPL and a filter is described (Langhorne et al) to identify level ice. Level ice in-phase, quadrature and SIPL thickness, derived from these, are presented at locations of level ice. For rough ice, the in-phase component is considered the best measure of sea ice thickness. For level ice where there is the possibility of an SIPL, then the quadrature component is considered the best measure of ice thickness, along with SIPL thickness. All data are in meters.
-

Here we present physico-chemical data collected during two research cruises conducted to and across the Ross Sea, Antarctica in the summer of 2018 (February-March) and 2019 (January-February). The dataset includes measurements of temperature, salinity, oxygen, par and transmissivity obtained with a Sea-Bird Electronics (SBE) 911plus CTD. The CTD sensor was configured with SBE 3plus, SBE 4, and SBE 43 dual sensors for the parameters above, in addition to a seapoint fluorescence sensor, and a photosynthetically active radiation (PAR) sensor (Biospherical Instruments QCP‐2300L‐HP). These data were used to provide oceanographic context to DNA metabarcoding analysis of 18S rRNA V4 region that was carried out on DNA samples collected in parallel to nutrient and chlorophyll-a samples. Fastq samples from DNA metabarcoding analysis and the associated metadata (including nutrients, Chlorophyll-a, and size-fractionated chlorophyll-a) were deposited to GenBank under project numbers PRJNA756172 (2018 cruise) and PRJNA974160 (2019 cruise). The study resulting from this analysis has been submitted to Limnology and Oceanography. RELATED PUBLICATION: Cristi, A., Law, C.S., Pinkerton, M., Lopes dos Santos, A., Safi, K. and Gutiérrez-Rodríguez, A. (2024). Environmental driving forces and phytoplankton diversity across the Ross Sea region during a summer–autumn transition. Limnol Oceanogr. https://doi.org/10.1002/lno.12526
-
The data are approximately 800 km of airborne electromagnetic survey of coastal sea ice and sub-ice platelet layer (SIPL) thickness distributions in the western Ross Sea, Antarctica, from McMurdo Sound to Cape Adare. Data were collected between 8 and 13 November 2017, within 30 days of the maximum fast ice extent in this region. Approximately 700 km of the transect was over landfast sea ice that had been mechanically attached to the coast for at least 15 days. Most of the ice was first-year sea ice. Unsmoothed in-phase and quadrature components are presented at all locations. Data have been smoothed with an 100 point median filter, and in-phase and quadrature smoothed data are also presented at all locations. Beneath level ice it is possible to identify the thickness of an SIPL and a filter is described (Langhorne et al) to identify level ice. Level ice in-phase, quadrature and SIPL thickness, derived from these, are presented at locations of level ice. For rough ice, the in-phase component is considered the best measure of sea ice thickness. For level ice where there is the possibility of an SIPL, then the quadrature component is considered the best measure of ice thickness, along with SIPL thickness. All data are in meters.
-
This data publication contains biostratigraphic age events for the CIROS-1 drill core, updated age ranges for a suite of samples from the McMurdo erratics sample collection, age-depth tie points for CIROS-1, CRP-2/2A, DSDP 270, DSDP 274, ANDRILL 2A and ANDRILL 1B, and glycerol dialkyl glycerol tetraethers (GDGTs) abundances and indices for samples from the McMurdo erratics, CIROS-1, CRP-2/2A, DSDP 270, DSDP 274, ANDRILL 2A, and ANDRILL 1B. All sample sites are in the Ross Sea region of Antarctica. The McMurdo erratics are glacial erratics collected in the McMurdo Sound region between 1991 and 1996 (Harwood and Levy, 2000). The CIROS-1 drill core was collected from McMurdo sound in 1986 with samples spanning the upper Eocene to lower Miocene. CRP-2/2A drill core was collected in 1999 from offshore Victoria Land with samples for this study from the upper Oligocene-lower Miocene. DSDP Site 270 was recovered from the Eastern Basin of the central Ross Sea in 1973, with samples spanning the upper Oligocene-lower Miocene. DSDP Site 274 was drilled on the lower continental rise in the northwestern Ross Sea in 1973, and samples for this study have been taken from the middle Miocene sections of the drill core. The ANDRILL-2A core was recovered in 2007 from Southern McMurdo Sound, samples span the lower Miocene to middle Miocene and data was originally published in Levy et al. (2016). The ANDRILL-IB core was drilled from the McMurdo Ice Shelf in 2006, samples are compiled from the Plio-Pleistocene section of the core and were originally published in McKay et al. (2012). Biostratigraphic age events are described for CIROS-1, expanding on and updating previously published age models and biostratigraphic ranges. Ages are also revised for the McMurdo erratics by updating the ages of the biostratigraphic markers described by (Harwood and Levy (2000) to more recently published age ranges. Age models for the sample sites are developed using published age datums and the Bayesian age-depth modelling functionality in the R package Bchron (Haslett and Parnell, 2008) to ensure a consistent approach for assigning ages to core depths between datums. GDGT abundances and indices for Ross Sea sites are presented to reconstruct ocean temperatures over the Cenozoic era. Detailed methodology for the processing and analysis of samples for GDGTs is described in the methods section of supplement paper.
-
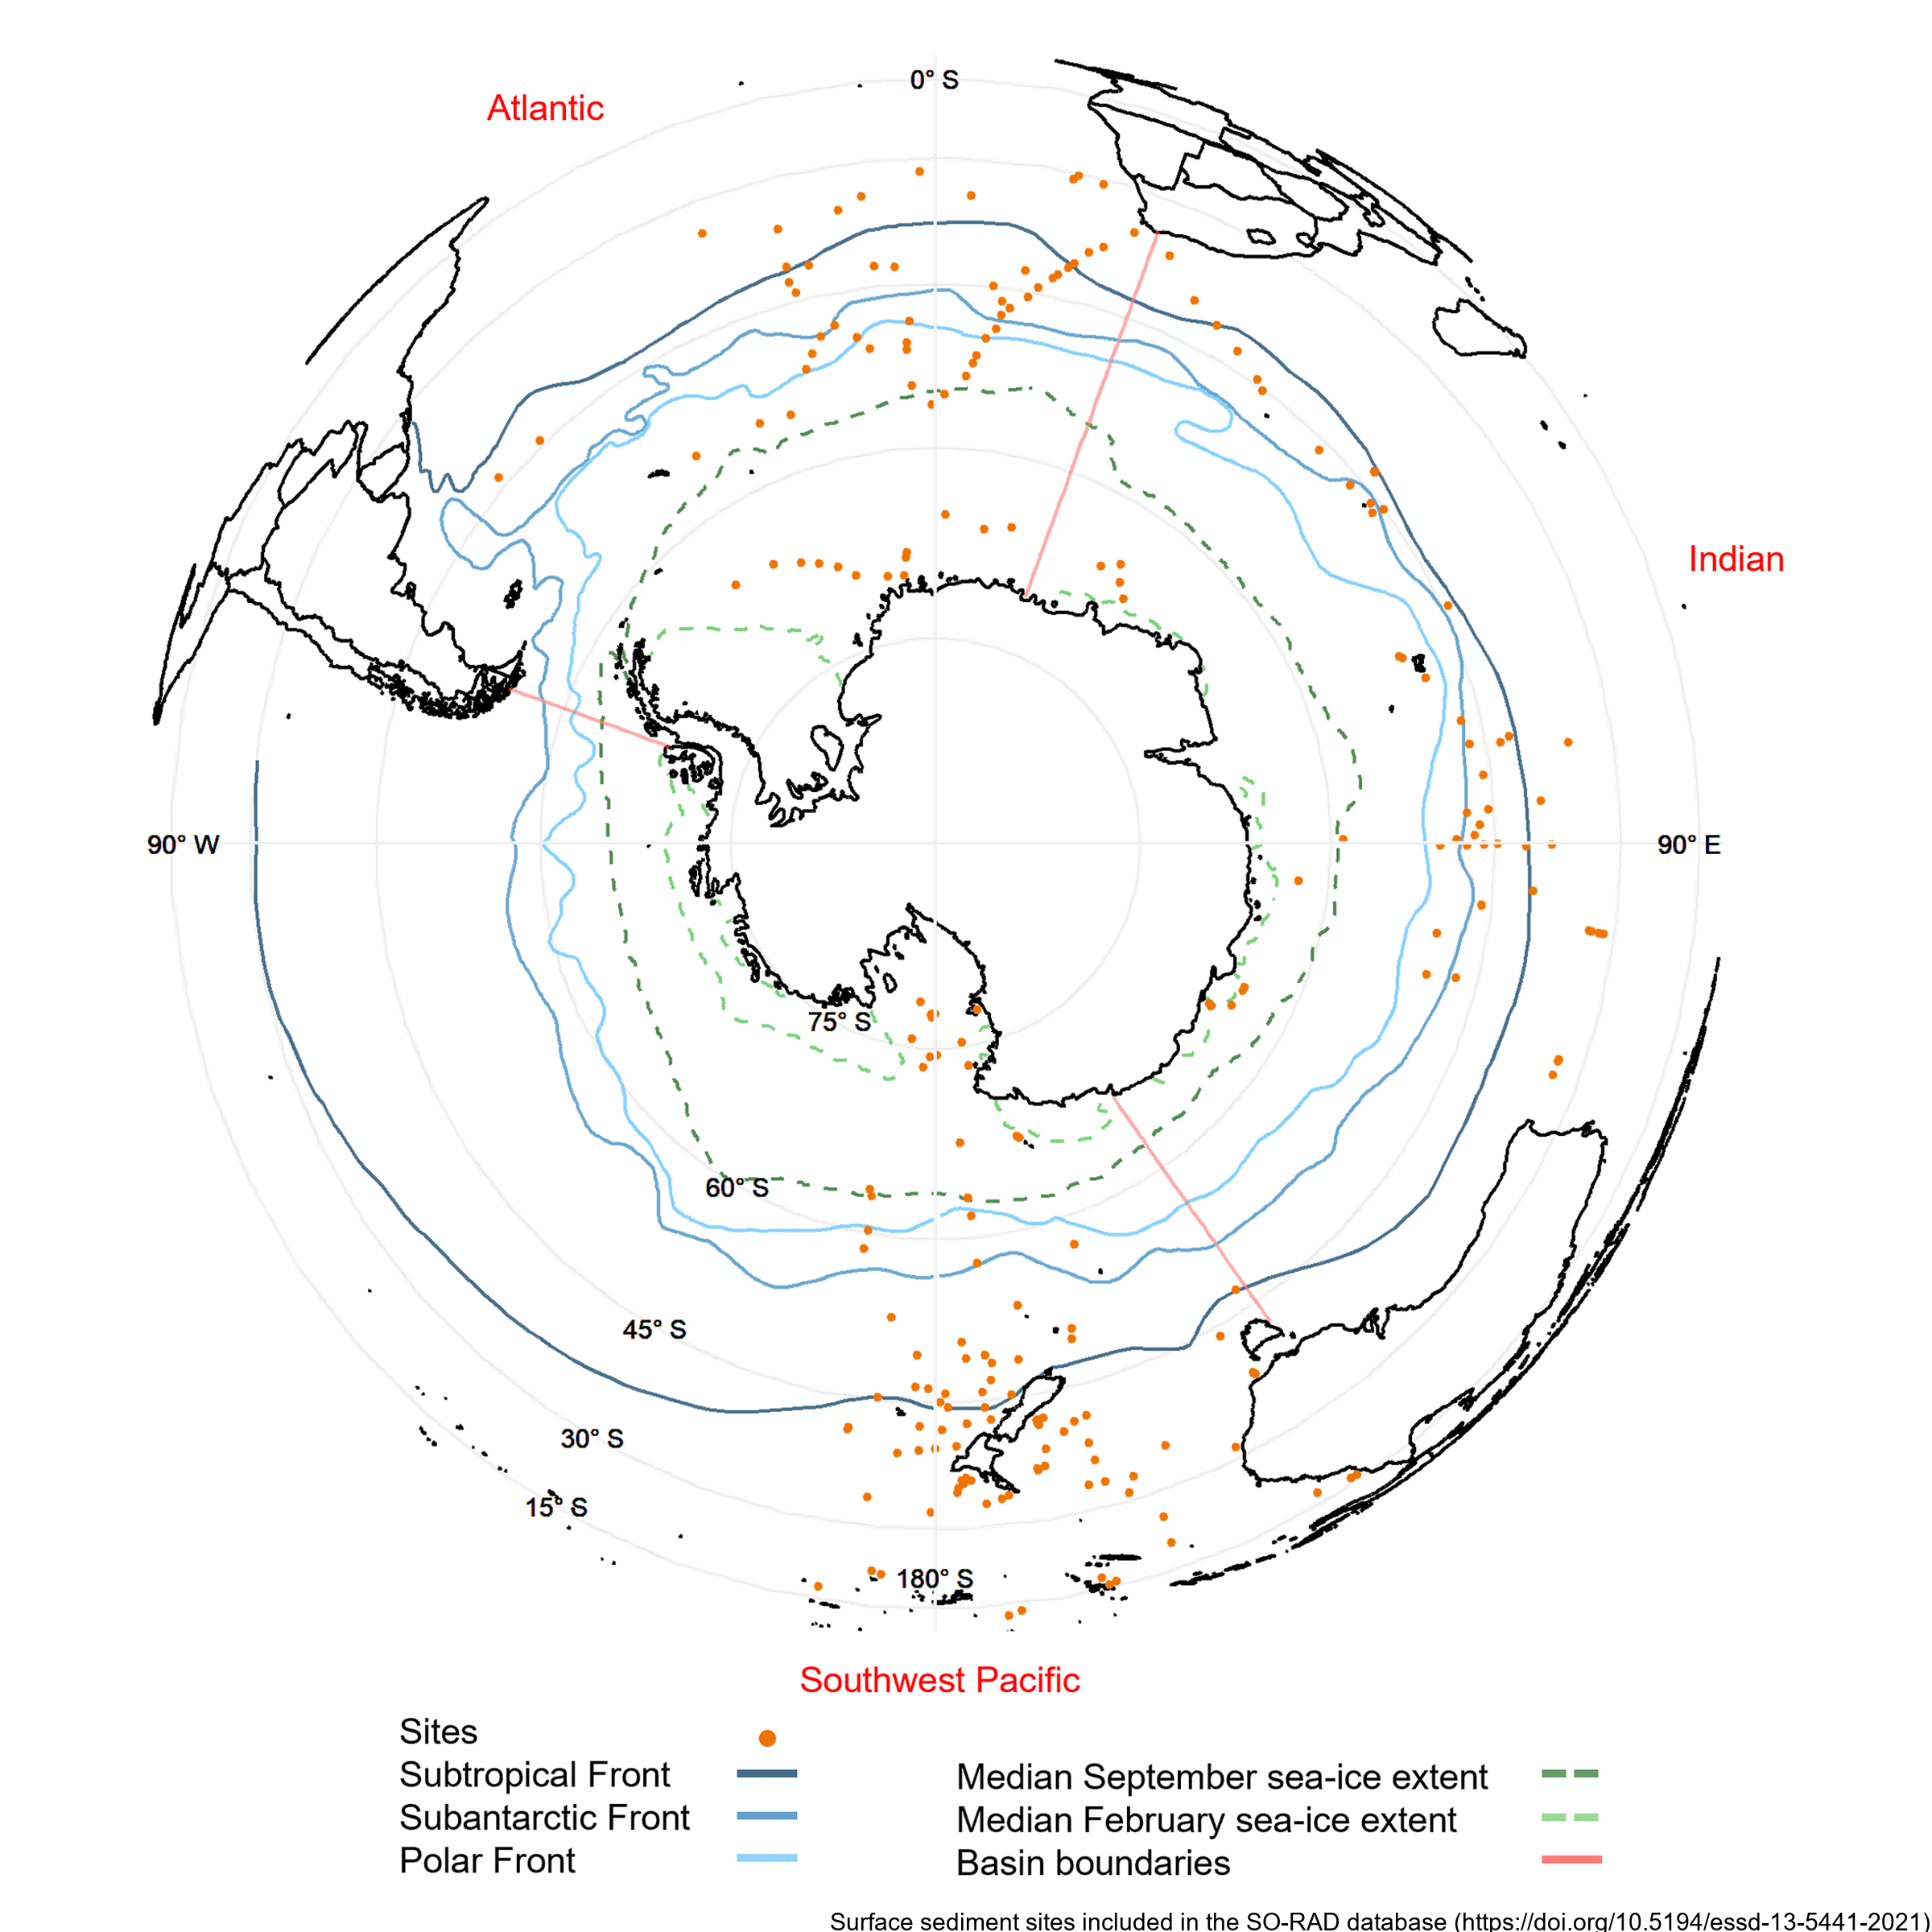
Radiolarians (holoplanktonic Protozoa) found in marine sediments are commonly used in Southern Ocean as palaeoclimate proxies. Generating such reconstructions of past climate based on radiolarian abundances requires a spatially and environmentally comprehensive reference dataset of modern radiolarian census counts. The Southern Ocean RADiolarian (SO-RAD) dataset includes census counts for 237 radiolarian taxa from 228 surface sediment samples located in the Atlantic, Indian and South-west Pacific sectors of the Southern Ocean. This compilation is the largest radiolarian census dataset derived from surface sediment samples in the Southern Ocean. The SO-RAD dataset may be used as a reference dataset for palaeoceanographic reconstructions, or for studying modern radiolarian biogeography and species diversity. RELATED PUBLICATION: https://doi.org/10.5194/essd-13-5441-2021
-
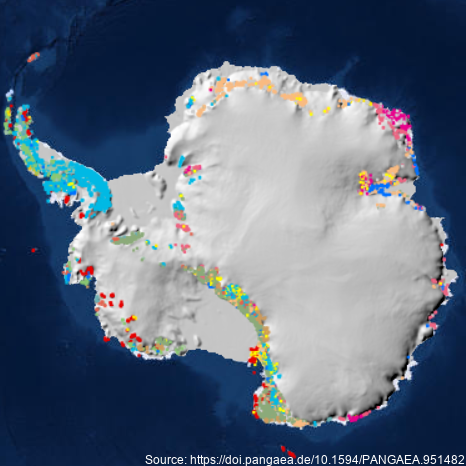
A dataset describing exposed bedrock and surficial geology of Antarctica constructed by the GeoMAP Action Group of SCAR (The Scientific Committee on Antarctic Research) and GNS Science, New Zealand. Legacy geological map data have been captured into a geographic information system (GIS), refining its spatial reliability, harmonising classification, then improving representation of glacial sequences and geomorphology. A total 99,080 polygons have been unified for depicting geology at 1:250,000 scale, but locally there are some areas with higher spatial precision. Geological definition in GeoMAP v.2022-08 is founded on a mixed chronostratigraphic- and lithostratigraphic-based classification. Description of rock and moraine polygons employs international GeoSciML data protocols to provide attribute-rich and queriable data; including bibliographic links to 589 source maps and scientific literature. Data are provided under CC-BY License as zipped ArcGIS geodatabase, QGIS geopackage or GoogleEarth kmz files. GeoMAP is the first detailed geological dataset covering all of Antarctica. GeoMAP depicts 'known geology' of rock exposures rather than 'interpreted' sub-ice features and is suitable for continent-wide perspectives and cross-discipline interrogation. Further details are provided at: Cox, S.C., Smith Lyttle, B., Elkind, S. et al. A continent-wide detailed geological map dataset of Antarctica. Sci Data 10, 250 (2023). https://doi.org/10.1038/s41597-023-02152-9 GET DATA: https://doi.pangaea.de/10.1594/PANGAEA.951482