 GeoData.NZ
K131A
Type of resources
Available actions
Topics
Keywords
Contact for the resource
Provided by
Years
Update frequencies
status
-
Sea ice temperature (°C) measured across multiple depths at (LATITUDE: -77.792300, LONGITUDE: 166.514900). Related Publication: Richter ME, Leonard GH, Smith IJ, Langhorne PJ, Mahoney AR, Parry M. Accuracy and precision when deriving sea-ice thickness from thermistor strings: a comparison of methods. Journal of Glaciology. 2023;69(276):879-898. doi:10.1017/jog.2022.108 GET DATA: https://doi.org/10.1594/PANGAEA.880164
-
Sea ice temperature (°C) measured across 11 depths (57 cm, 78.5 cm, 84.5 cm, 87.5 cm, 96.5 cm, 105.5 cm, 108.5 cm, 114.5 cm, 117.5 cm, 120.5 cm, 129.5 cm) at (LATITUDE: -77.781700, LONGITUDE: 166.315300): Related Publication: Richter ME, Leonard GH, Smith IJ, Langhorne PJ, Mahoney AR, Parry M. Accuracy and precision when deriving sea-ice thickness from thermistor strings: a comparison of methods. Journal of Glaciology. 2023;69(276):879-898. doi:10.1017/jog.2022.108
-
Sea ice temperature (°C) measured across multiple depths from 20 cm to 207.5 cm at (latitude: -77.775800, longitude: 166.312800): Related Publication: Richter ME, Leonard GH, Smith IJ, Langhorne PJ, Mahoney AR, Parry M. Accuracy and precision when deriving sea-ice thickness from thermistor strings: a comparison of methods. Journal of Glaciology. 2023;69(276):879-898. doi:10.1017/jog.2022.108
-
Sea ice temperature (°C) measured across multiple depths at (LATITUDE: -77.794900, LONGITUDE: 166.334700). Related Publication: Richter ME, Leonard GH, Smith IJ, Langhorne PJ, Mahoney AR, Parry M. Accuracy and precision when deriving sea-ice thickness from thermistor strings: a comparison of methods. Journal of Glaciology. 2023;69(276):879-898. doi:10.1017/jog.2022.108 GET DATA: https://doi.org/10.1594/PANGAEA.880165
-
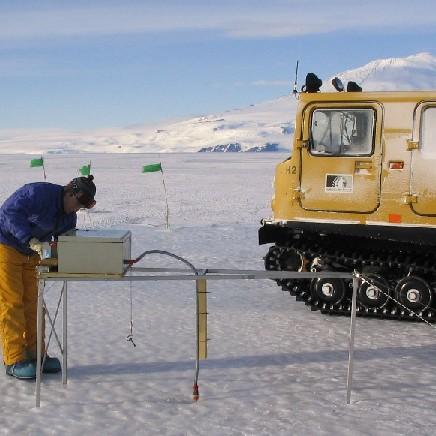
Data provided here have been collected as part of the project "Measurements and Improved Parameterization of the Thermal Conductivity and Heat Flow through First-Year Sea Ice", OPP-0126007* and include measurements of temperature and various ice properties at selected sites in first-year and multiyear sea ice in McMurdo Sound, Antarctica in the years 2002-2004. Data from earlier installations of thermistor chains for measurements of ice temperature carried out by the New Zealand team have also been included. Data files are in Microsoft Excel format, with individual worksheets for specific cores or temperature data sets. Detailed information and comments on data sampling location etc. are provided in the files. Further information on data collection, results etc. can be found in the following publications: Backstrom, L. G. E., and H. Eicken 2007, submitted, Capacitance probe measurements of brine volume and bulk salinity in first-year sea ice, Cold Reg. Sci. Tech. Pringle, D. J., H. Eicken, H. J. Trodahl, and L. G. E. Backstrom 2007, submitted, Thermal conductivity of landfast Antarctic and Arctic sea ice, J. Geophys. Res. Trodahl, H. J., S. O. F. Wilkinson, M. J. McGuinness, and T. G. Haskell 2001, Thermal conductivity of sea ice; dependence on temperature and depth, Geophys. Res. Lett., 28, 1279-1282. Data are in Microsoft Excel format. Abbreviations: AH = Arrival Heights; CH = Camp Haskell (near Delbridge Islands); VUW = Victoria University Wellington; UAF = University Alaska Fairbanks. RELATED PUBLICATION: https://doi.org/10.1017/jog.2022.108 GET DATA: https://drive.google.com/drive/folders/1ooUH9dPvWT66afFC51Cb0JOHg66rn0sy
-
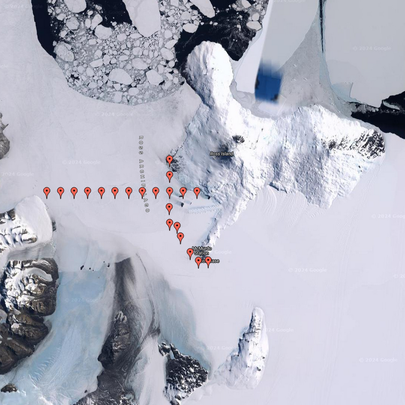
Sea ice thickness and sub-ice platelet layer thickness under sea ice was measured in regular intervals. Holes were drilled into sea ice at measurement sites about 5 km apart. The thickness was measured using measurement tapes. Snow depth on sea ice was also measured at sites.
-
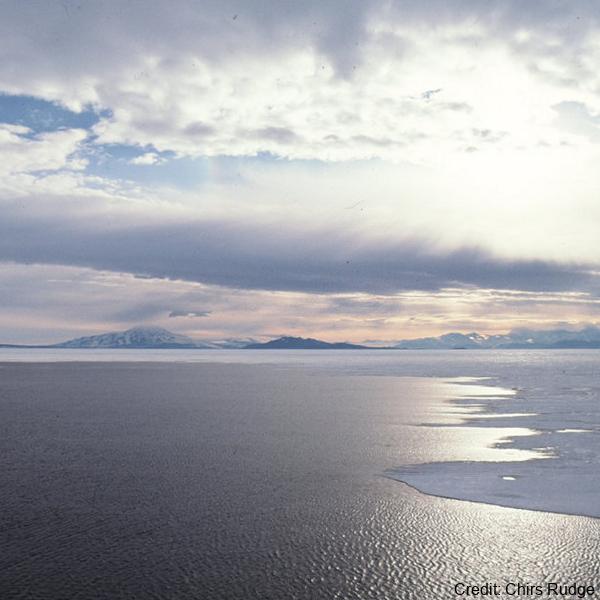
Temperature and salinity observations were made at nominal depths of 75 m and 100 m, respectively, by Sea Bird Electronics sensors. Acoustic volume backscatter measurements were made by an ASL Environmental Sciences Acoustic Zooplankton Fish Profiler (AZFP) operating at four-frequencies (125 kHz, 200 kHz, 455 kHz and 769 kHz). The AZFP profiled the top 25 m of the water column in 0.1 m bins. All instruments were deployed through a landfast sea ice cover that was approximately 2 m thick. The WWW Tide and Current Predictor model was used to generate tidal height forecasts for the deployment periods. Ocean salinity was recorded at 10 second intervals by a Seabird Electronics SBE 37 microCAT CTD at a nominal depth of 100 m in McMurdo Sound at 77.6152 °S, 164.8821 °E. The dates covered by the salinity observations at 100 m depth are from 28-10-2016 06:43:11 UTC to 13-11-2016 21:59:51 UTC. The salinity is reported in units of practical salinity. Ocean temperature was recorded at 10 second intervals by a Seabird Electronics SBE 56 thermistor at a nominal depth of 75 m in McMurdo Sound at 77.6152 °S, 164.8821 °E. The dates covered by the temperature observations at 75 m depth are from 28-10-2016 06:43:11 UTC to 13-11-2016 21:59:51 UTC and 3-11-2017 08:26:01 UTC to 20-11-2017 23:00:01 UTC. The temperature is reported in units of °C in the ITS-90 temperature scale. Tidal height forecast data were produced from the WWW Tide and Current Predictor (http://tbone.biol.sc.edu/tide/tideshow.cgi?site=Ross+Island%2C+Antarctica) for Ross Island, Antarctica, for the period of the 2016 AZFP deployments. Related publication: Frazer, E. K., Langhorne, P. J., Leonard, G. H., Robinson, N. J., & Schumayer, D. (2020). Observations of the size distribution of frazil ice in an Ice Shelf Water plume. Geophysical Research Letters, 47, e2020GL090498. https://doi.org/10.1029/2020GL090498 GET DATA: https://doi.org/10.1594/PANGAEA.923762
-
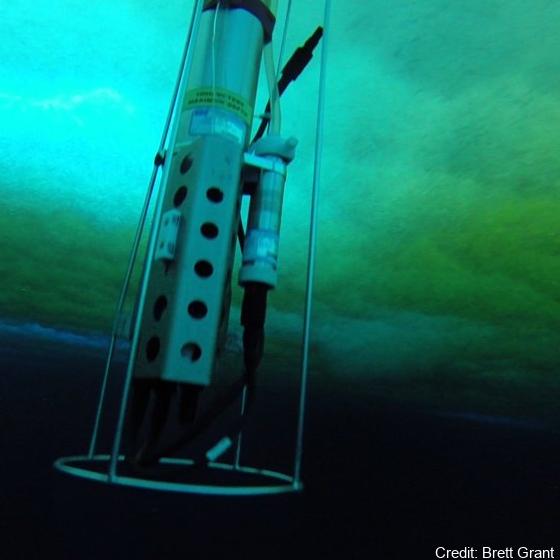
Data from a measurement campaign examining the oceanic connection between an ice shelf cavity and sea ice. Here we present data from the ocean boundary-layer in an Ice Shelf Water outflow region from the Ross/McMurdo Ice Shelves. From a fast ice field camp during the Spring of 2015, we captured the kinematics of free-floating relatively large (in some cases 10s of mm in scale) ice crystals that were advecting and then settling upwards in a depositional layer on the sea ice underside (SIPL, sub-ice platelet layer). Simultaneously, we measured the background oceanic temperature, salinity, currents and turbulence structure. At the camp location the total water depth was 536 m, with the uppermost 50 m of the water column being in-situ super-cooled. Tidal flow speeds had an amplitude of around 0.1 m s-1 with dissipation rates in the under-ice boundary layer measured to be up to e=10-6 W kg-1. Acoustic sampling (200 kHz) identified backscatter from large, individually identifiable suspended crystals associated with crystal sizes larger than normally described as frazil. Crystal sizes in the SIPL were also measured. RELATED PUBLICATION: https://doi.org/10.3389/fmars.2023.1103740 GET DATA: https://doi.org/10.17882/90432