 GeoData.NZ
HELICOPTER
Type of resources
Available actions
Topics
Keywords
Contact for the resource
Provided by
Years
Update frequencies
status
-
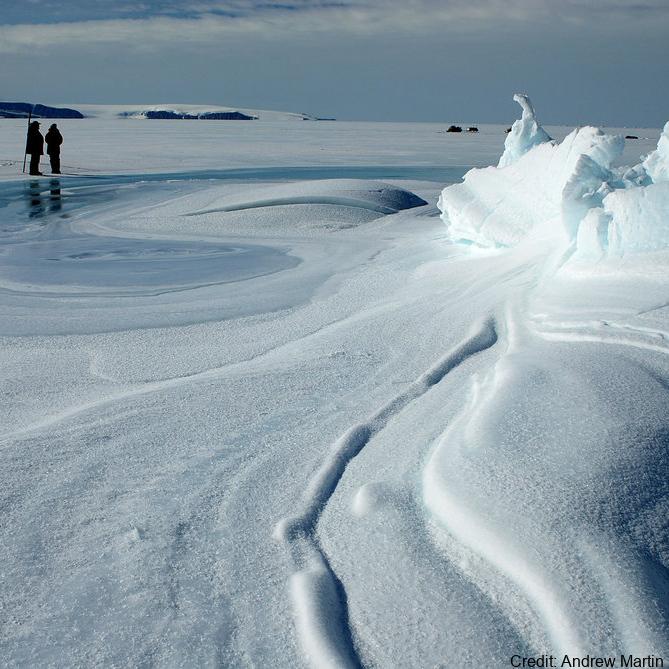
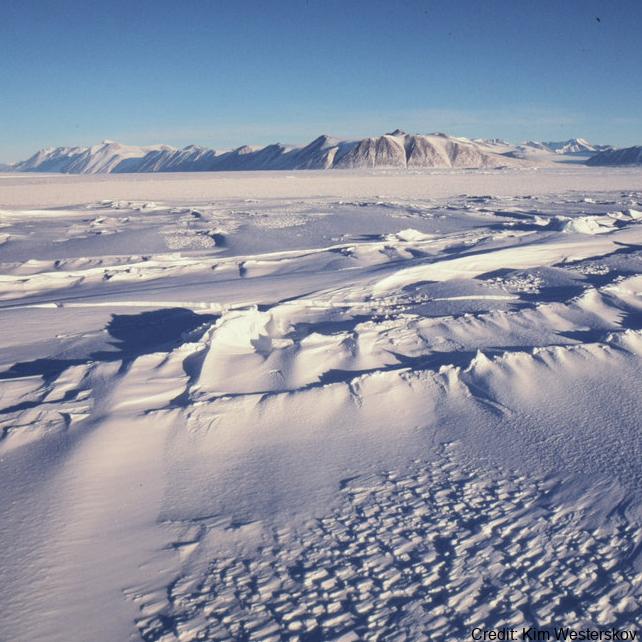
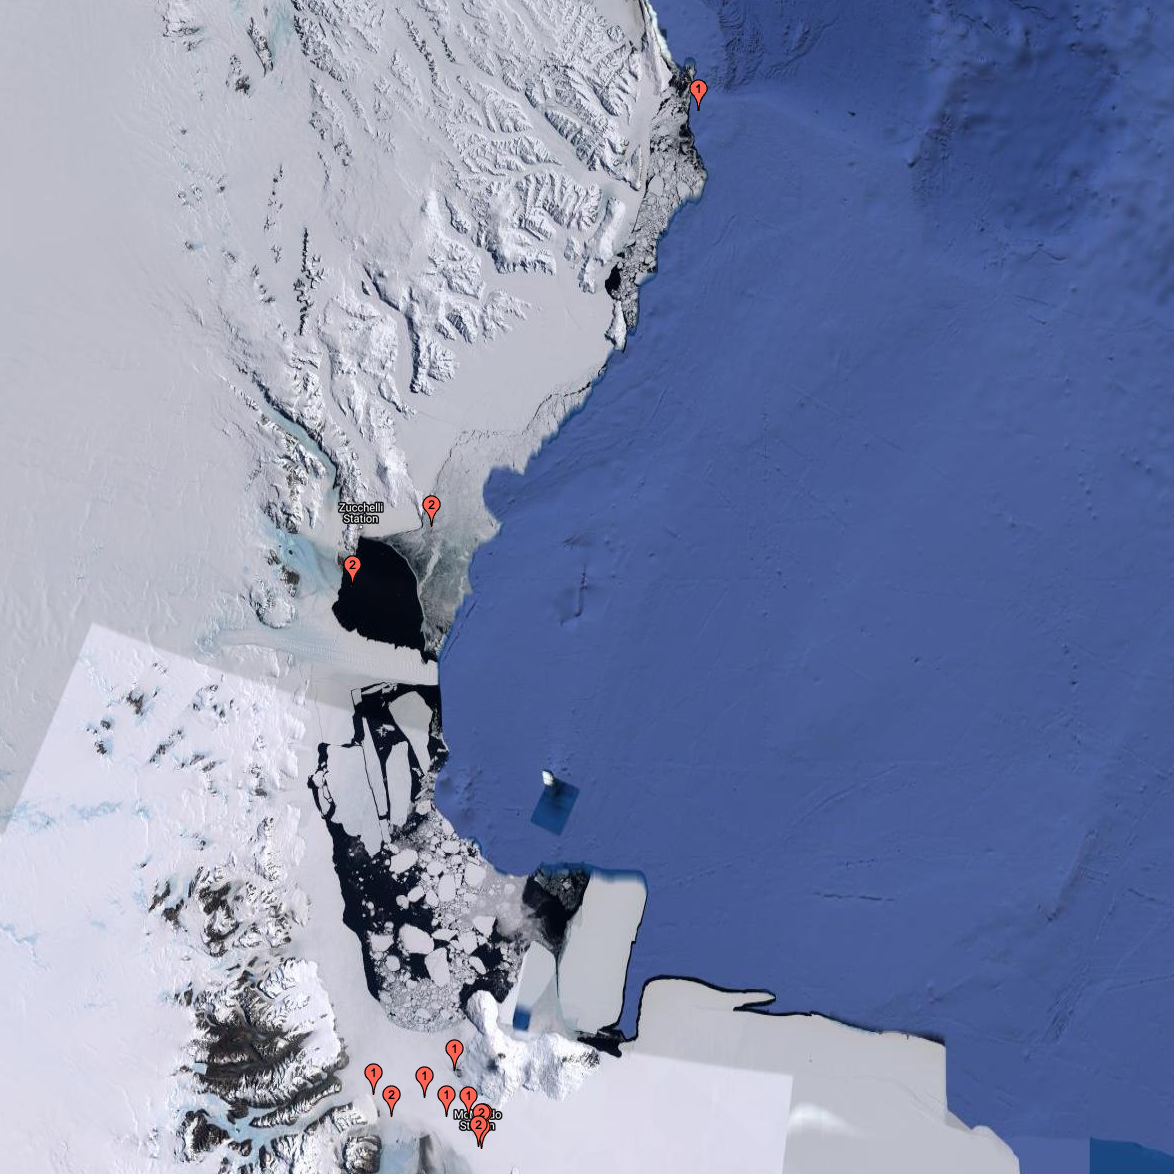
The data are approximately 800 km of airborne electromagnetic survey of coastal sea ice and sub-ice platelet layer (SIPL) thickness distributions in the western Ross Sea, Antarctica, from McMurdo Sound to Cape Adare. Data were collected between 8 and 13 November 2017, within 30 days of the maximum fast ice extent in this region. Approximately 700 km of the transect was over landfast sea ice that had been mechanically attached to the coast for at least 15 days. Most of the ice was first-year sea ice. Unsmoothed in-phase and quadrature components are presented at all locations. Data have been smoothed with an 100 point median filter, and in-phase and quadrature smoothed data are also presented at all locations. Beneath level ice it is possible to identify the thickness of an SIPL and a filter is described (Langhorne et al) to identify level ice. Level ice in-phase, quadrature and SIPL thickness, derived from these, are presented at locations of level ice. For rough ice, the in-phase component is considered the best measure of sea ice thickness. For level ice where there is the possibility of an SIPL, then the quadrature component is considered the best measure of ice thickness, along with SIPL thickness. All data are in meters.
-
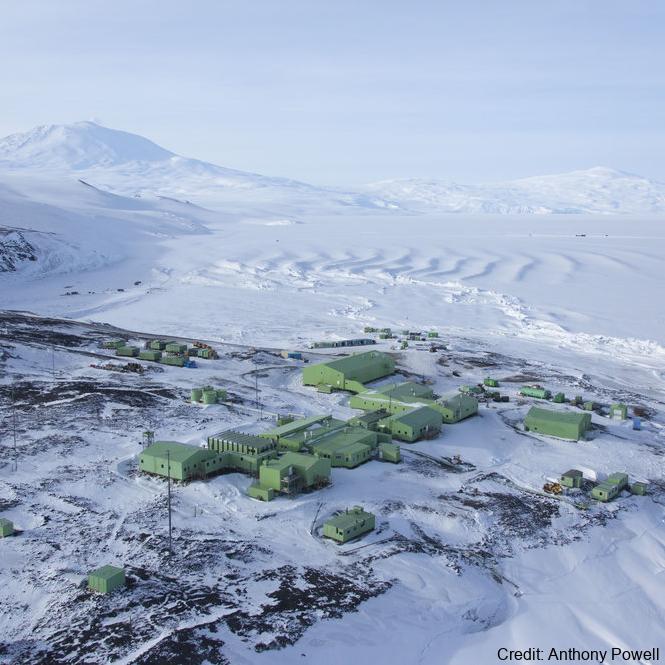
Aerial reconnaissance and photography are used in the Ross Sea sector of Antarctica to determine the breeding locations of Adélie penguins and to count the numbers of nests occupied during the early incubation period. From 1981 to present (two-year embargo), all islands and sea coasts between 158°E and 175°E have been searched, and 11 previously unreported breeding colonies discovered. The aim is to census Adélie (Pygoscelis adeliae) populations to provide basic data against which future population levels can be compared in order to monitor environmental change of the Antarctic Ocean ecosystem, both natural and man-induced. GET DATA: https://datastore.landcareresearch.co.nz/en_AU/dataset/adelie-penguin-census-data
-
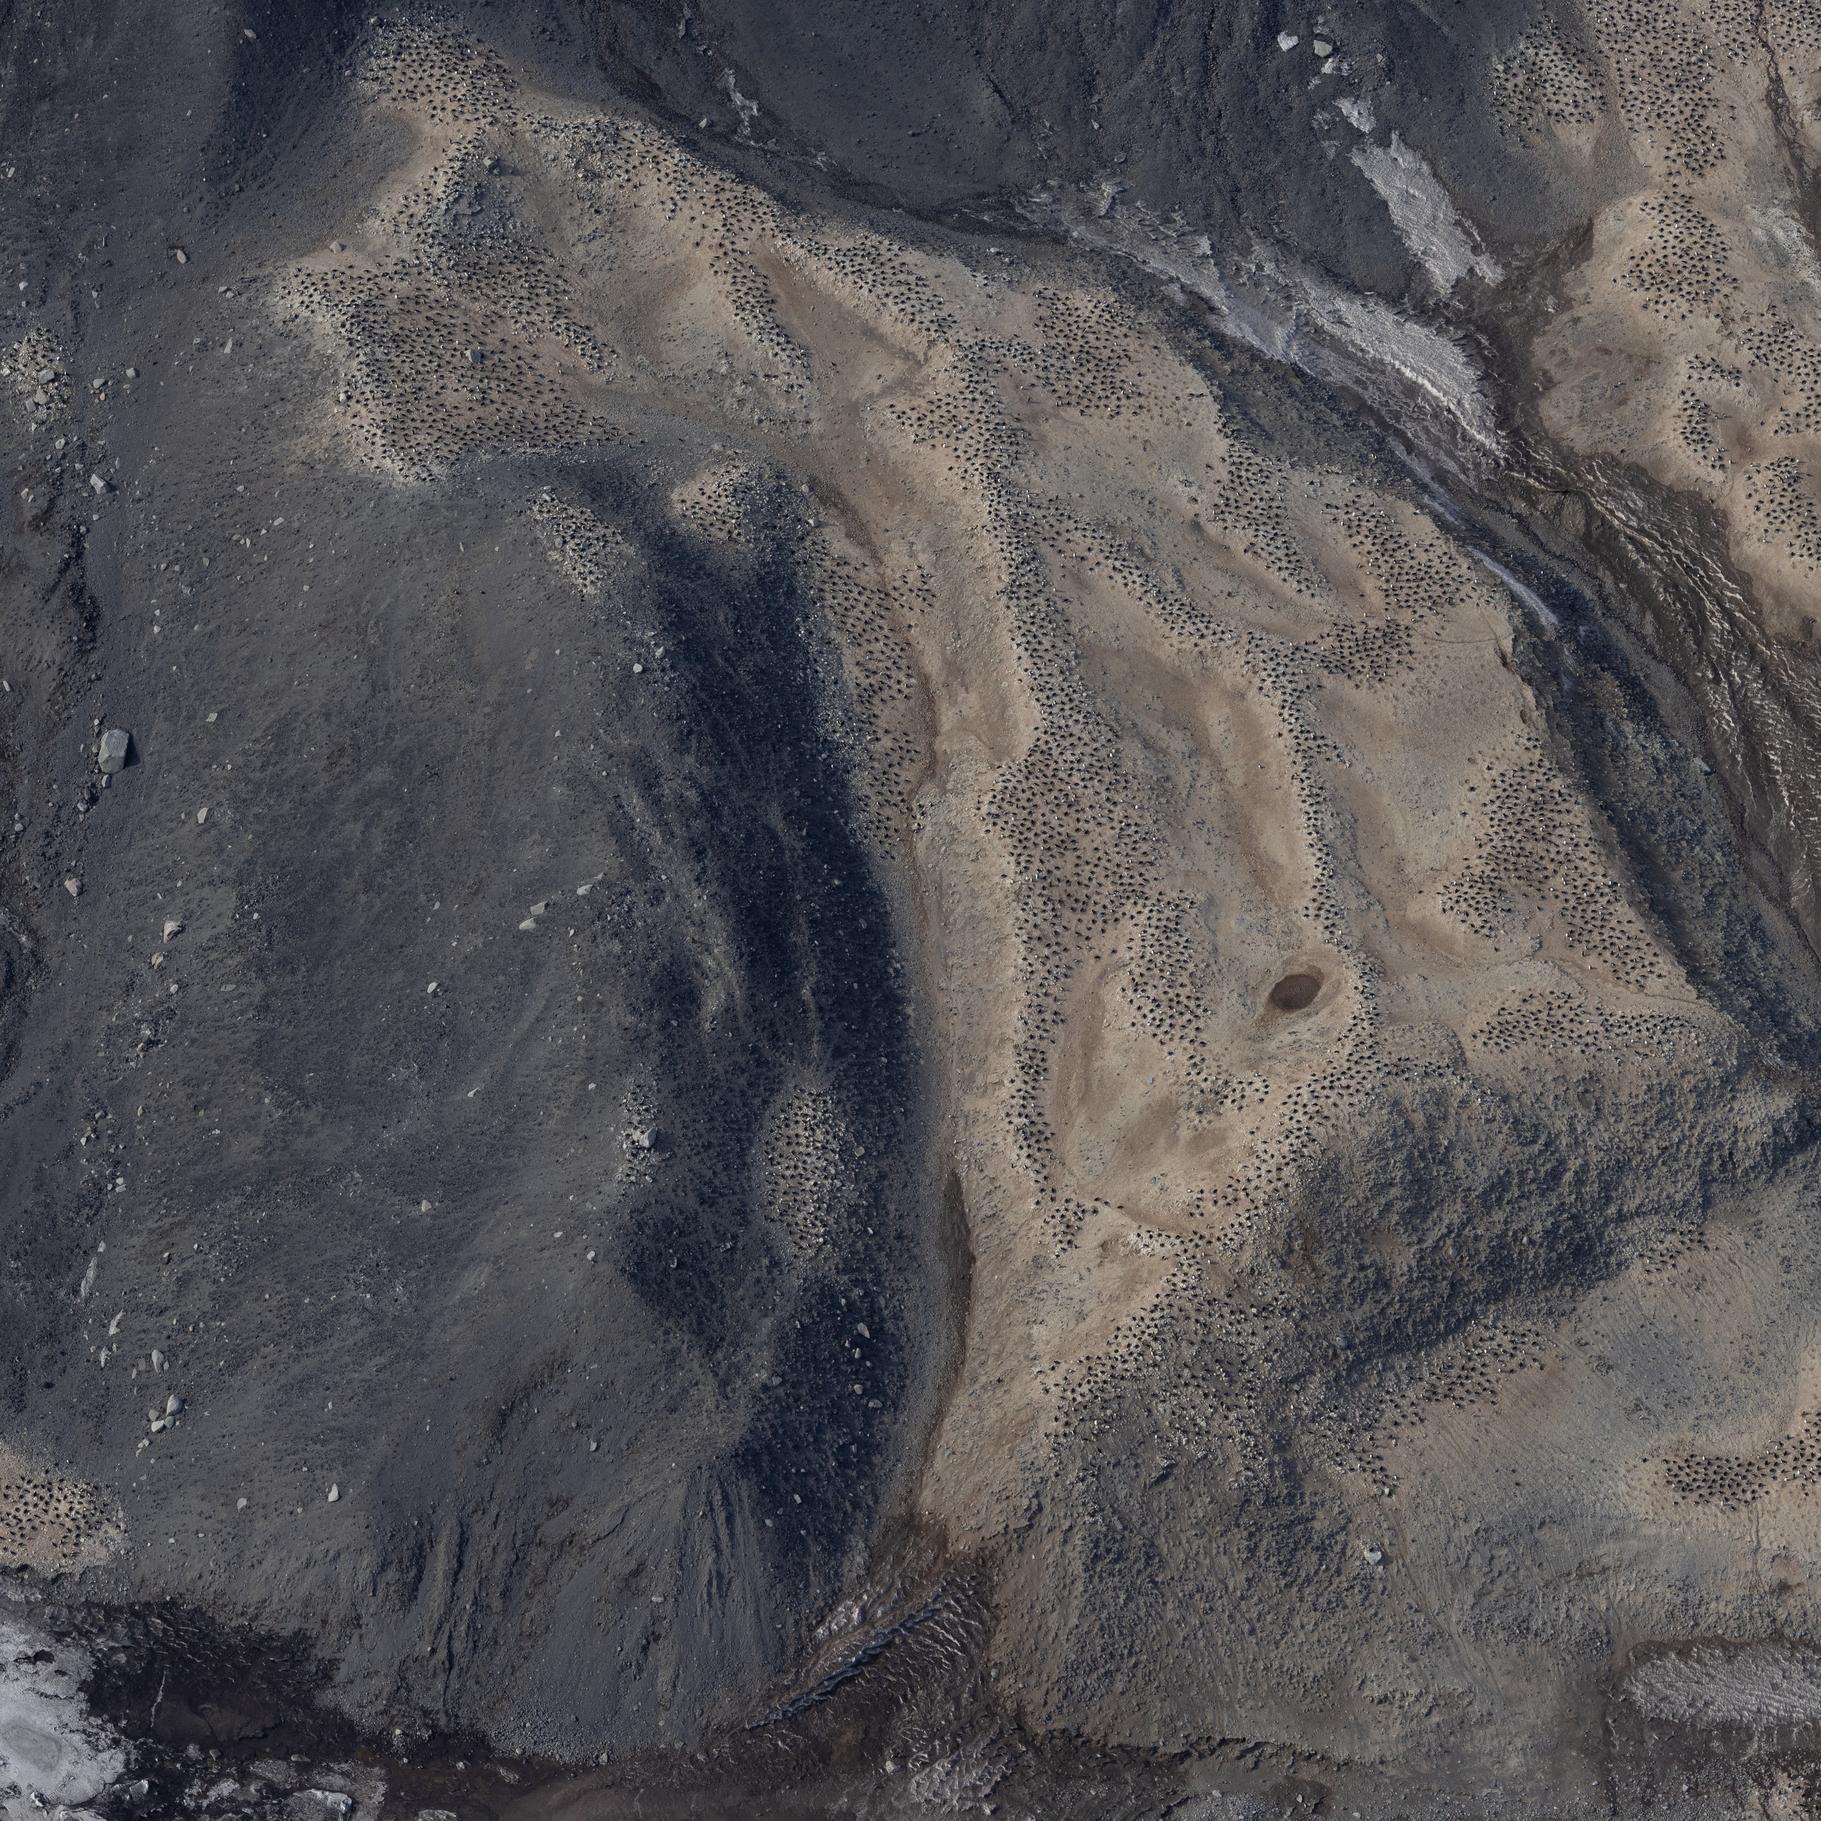
Raw images (over approximately 20.000 unique images) collected during the Adelie Penguin Census across 30+ colonies since 1981 (see associated metadata resource for list full list of colonies). Photographs were taken using a black and white film camera from 1981 to 2004 (inclusive) and 2008. Images are available in .tif fomrat. Images are digital from 2005 onwards (except 2008). Raw images are available in cr2/cr3 formats, and processed images are available across tif and jpg formats. High resolution scanning was initiated in 2011 to scan all the negatives in the collection. There are approximately 10,000 negatives in the collection. Images are taken from helicopter at between 2000-2500 feet. All images collected during the 2324 season are georeferenced with latitude and longitude positions in decimal degrees (WGS 84). Camera Settings: ISO = 400 Shutter speed = greater than 1/1000 Focus = manual, pre-focus to 800m Lens = 135mm with UV filter Aperture/ Exposure = F8 (or up to F11) Image Size = Full size White Balance Setting = Daylight Captures per minute = ~80 GET DATA: m.meredyth-young@antarcticanz.govt.nz
-
The data are approximately 800 km of airborne electromagnetic survey of coastal sea ice and sub-ice platelet layer (SIPL) thickness distributions in the western Ross Sea, Antarctica, from McMurdo Sound to Cape Adare. Data were collected between 8 and 13 November 2017, within 30 days of the maximum fast ice extent in this region. Approximately 700 km of the transect was over landfast sea ice that had been mechanically attached to the coast for at least 15 days. Most of the ice was first-year sea ice. Unsmoothed in-phase and quadrature components are presented at all locations. Data have been smoothed with an 100 point median filter, and in-phase and quadrature smoothed data are also presented at all locations. Beneath level ice it is possible to identify the thickness of an SIPL and a filter is described (Langhorne et al) to identify level ice. Level ice in-phase, quadrature and SIPL thickness, derived from these, are presented at locations of level ice. For rough ice, the in-phase component is considered the best measure of sea ice thickness. For level ice where there is the possibility of an SIPL, then the quadrature component is considered the best measure of ice thickness, along with SIPL thickness. All data are in meters.
-

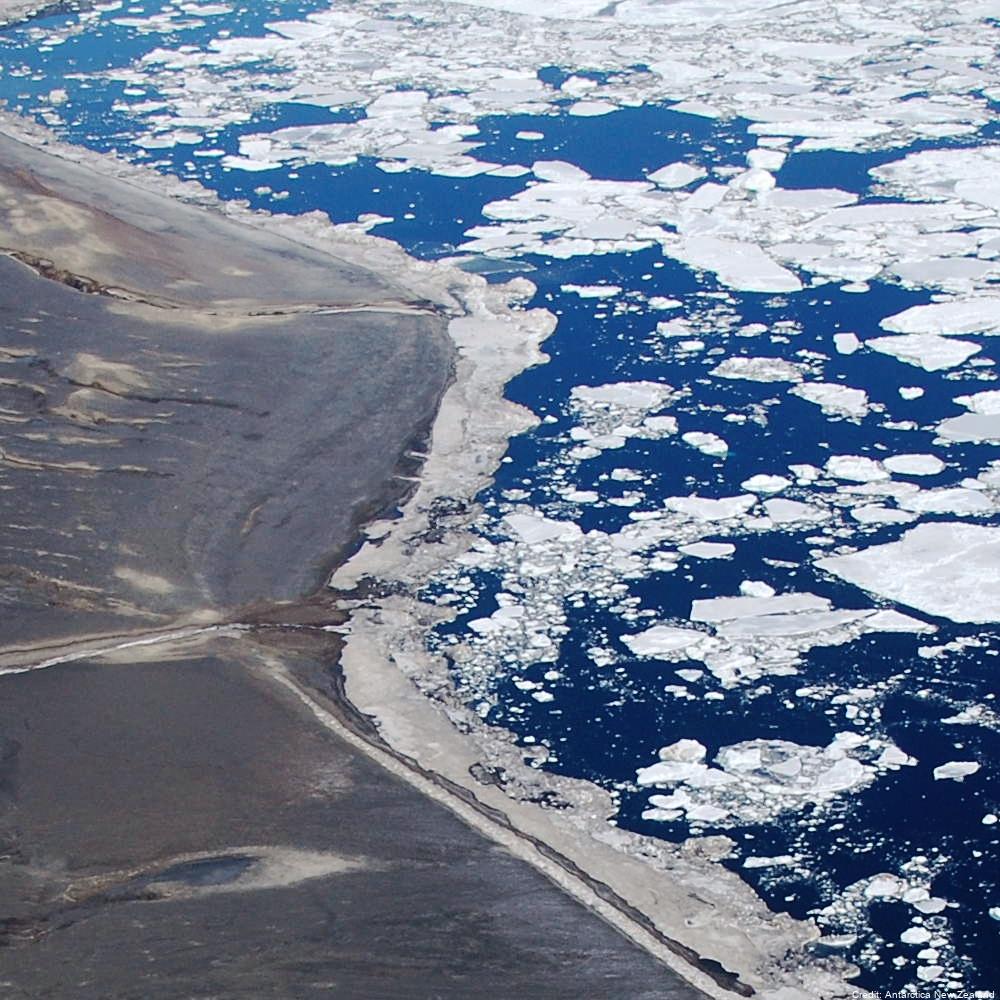
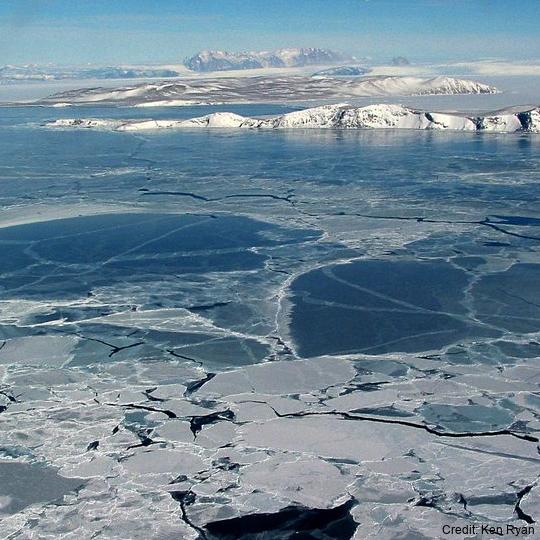
The data set contains sea ice thickness (consolidated ice plus snow) of pack ice in the Western Ross Sea acquired by fixed wing aircraft (BT-67 C-GJKB) between McMurdo Sound (77.68 S / 165.52E) and near Cape Adare (72.01 S / 171.53 E). Two survey profiles are oriented South - North near parallel and about 100km off the Victoria Land coast, and two survey profiles are leading into Terra Nova Bay oriented in East –West direction at around 74.5 S and 75 S. The total length of the survey profiles is about 800 km. The Southern survey was flown from 9 November 2017 22:19 UTC to 10 November 2017 00:25 UTC beginning in McMurdo Sound and went for 300 km to the north, before turning west into Terra Nova Bay for another 100 km. The Northern survey was flown on 11 November 2017 from 1:21 UTC to 3:04 UTC from near the Adare Peninsula in a southerly direction for 215 km before turning southwest towards Cape Washington for another 140 km. The airborne electromagnetic induction (AEM) ice thickness sensor was towed by a Basler BT-67 aircraft sampling thickness every 6m along the flight track. The accuracy of the measured ice thickness is +/-0.1m over level ice. Ice thicknesses are biased up to 50% low for pressure ridges smaller than the signal footprint of about 45 m. Data was collected with the support of Antarctica New Zealand (event K066-1718-A; 25/10/2017-28/11/2017) for the New Zealand National Science Challenge Deep South (Targeted observation and process informed modelling of Antarctic sea ice, PI P. Langhorne). The purpose of data collection was to gain a basic understanding of sea ice thickness close to the areas of the Ross Sea, McMurdo, and Terra Nova Bay Polynyas.
-
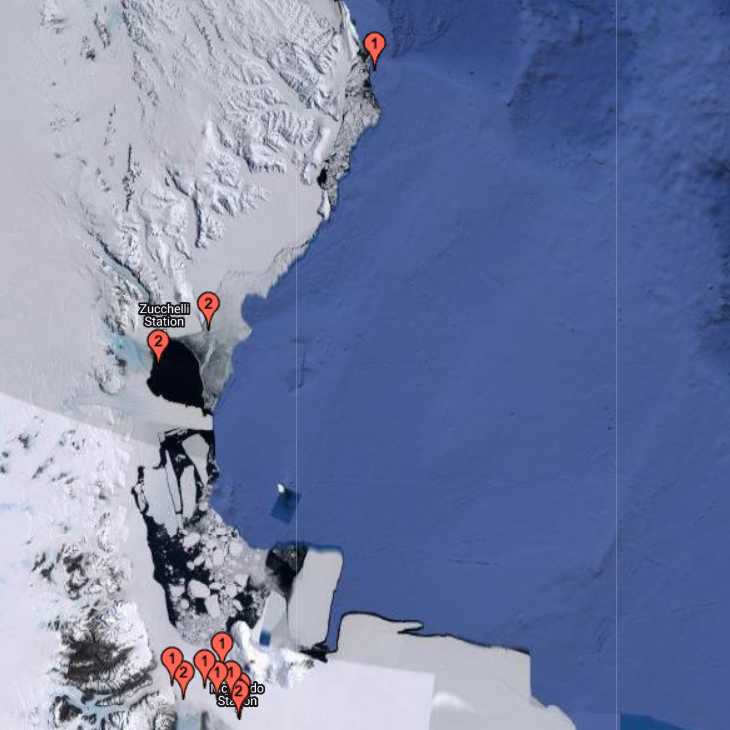
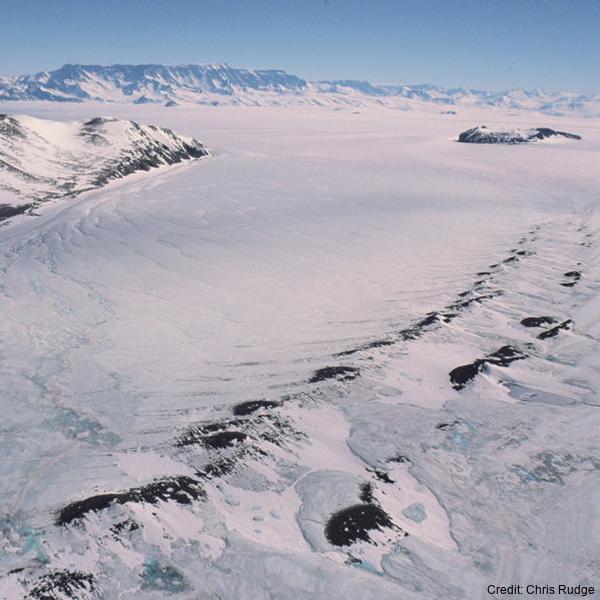
Data of apparent ice thickness from airborne electromagnetic (AEM) surveys of fast ice in McMurdo Sound, Antarctica, carried out in Nov/Dec 2009, 2011, 2013, 2016, and 2017. Values are given for apparent thicknesses derived from both, in-phase and quadrature signals. The difference between both thicknesses is a scaled measure of sub-ice platelet layer thickness. Data are from east-west transects across McMurdo Sound, at fixed latitudes. Data were smoothed and interpolated onto a regular longitude grid (0.001 degree increments). More information can be found in: Haas, C., Langhorne, P. J., Rack, W., Leonard, G. H., Brett, G. M., Price, D., Beckers, J. F., and Gough, A. J.: Airborne mapping of the sub-ice platelet layer under fast ice in McMurdo Sound, Antarctica, The Cryosphere, 15, 247–264, https://doi.org/10.5194/tc-15-247-2021, 2021
-
The data are approximately 800 km of airborne electromagnetic survey of coastal sea ice and sub-ice platelet layer (SIPL) thickness distributions in the western Ross Sea, Antarctica, from McMurdo Sound to Cape Adare. Data were collected between 8 and 13 November 2017, within 30 days of the maximum fast ice extent in this region. Approximately 700 km of the transect was over landfast sea ice that had been mechanically attached to the coast for at least 15 days. Most of the ice was first-year sea ice. Unsmoothed in-phase and quadrature components are presented at all locations. Data have been smoothed with an 100 point median filter, and in-phase and quadrature smoothed data are also presented at all locations. Beneath level ice it is possible to identify the thickness of an SIPL and a filter is described (Langhorne et al) to identify level ice. Level ice in-phase, quadrature and SIPL thickness, derived from these, are presented at locations of level ice. For rough ice, the in-phase component is considered the best measure of sea ice thickness. For level ice where there is the possibility of an SIPL, then the quadrature component is considered the best measure of ice thickness, along with SIPL thickness. All data are in meters.
-
Data of apparent ice thickness from airborne electromagnetic (AEM) surveys of fast ice in McMurdo Sound, Antarctica, carried out in Nov/Dec 2009, 2011, 2013, 2016, and 2017. Values are given for apparent thicknesses derived from both, in-phase and quadrature signals. The difference between both thicknesses is a scaled measure of sub-ice platelet layer thickness. Data are from east-west transects across McMurdo Sound, at fixed latitudes. Data were smoothed and interpolated onto a regular longitude grid (0.001 degree increments). More information can be found in Haas et al. (2021). Related Publication: Haas, C., Langhorne, P. J., Rack, W., Leonard, G. H., Brett, G. M., Price, D., Beckers, J. F., and Gough, A. J.: Airborne mapping of the sub-ice platelet layer under fast ice in McMurdo Sound, Antarctica, The Cryosphere, 15, 247–264, https://doi.org/10.5194/tc-15-247-2021, 2021