 GeoData.NZ
2022
Type of resources
Available actions
Topics
Keywords
Contact for the resource
Provided by
Years
Formats
Representation types
Update frequencies
status
Scale
Resolution
-
Orthophotography within the Canterbury Region captured in the flying season of 2022-2023. Coverage encompasses locations within the Timaru District including Geraldine, Orari, Winchester, Temuka, Pleasant Point, Timaru city, and Pareora. Imagery was captured for Environment Canterbury by Landpro Ltd between the 29 December 2022 and 2 March 2022. Data comprises: • 1176 ortho-rectified RGB GeoTIFF images in NZTM projection, tiled into the LINZ Standard 1:500 tile layout. • Tile layout in NZTM projection containing relevant information. Imagery supplied with a 7.5cm pixel resolution (0.075m GSD). Also available on: • [LINZ Basemaps](https://basemaps.linz.govt.nz/@-44.2825704,171.2109375,z9.73?i=timaru-2022-2023-0.1m) • [NZ Imagery - Registry of Open Data on AWS](https://registry.opendata.aws/nz-imagery/) Index tiles for this dataset are available as layer [Timaru 0.075m Urban Aerial Photos Index Tiles (2022-2023)](http://data.linz.govt.nz/layer/115075)
-
Orthophotography within the Taranaki Region captured in January 2022. Coverage encompasses New Plymouth, Inglewood, Lepperton, Ōkato, Tongapōrutu, Urenui, Hāwera, Normanby, Okaiawa, Manaia, and Kupe. Imagery was captured for Taranaki Regional Council by Aerial Surveys Ltd, Unit A1, 8 Saturn Place, Albany 0632, New Zealand. Data comprises: • 2982 ortho-rectified RGB GeoTIFF images in NZTM projection, tiled into the LINZ Standard 1:500 tile layout • Tile layout in NZTM projection containing relevant information. The supplied imagery is in terms of New Zealand Transverse Mercator (NZTM) map projection. Please refer to the tile index layer for specific details, naming conventions, etc. Imagery supplied as 10cm pixel resolution (0.1m GSD), 3-band (RGB) uncompressed GeoTIFF. The final spatial accuracy is ±0.15 at 95% confidence level in clear flat areas. Index tiles for this dataset are available as layer [Taranaki 0.1m Urban Aerial Photos Index Tiles (2022)](http://data.linz.govt.nz/layer/110559)
-
This layer contains the DSM for LiDAR data in the Otago Region, covering Wānaka, Lake Hāwea, and Luggate, captured between the 27 November 2022 to 11 January 2023. - The DEM is available as layer [Otago - Wānaka LiDAR 1m DEM (2022-2023)](https://data.linz.govt.nz/layer/113095). - The index tiles are available as layer [Otago - Wānaka LiDAR Index Tiles (2022-2023)](https://data.linz.govt.nz/layer/113097). - The LAS point cloud and vendor project reports are available from [OpenTopography](https://portal.opentopography.org/datasets?search=new%20zealand). LiDAR was captured for Queenstown Lakes District Council by Landpro Ltd between 27 November 2022 to 11 January 2023. These datasets were generated by Landpro and their subcontractors. Data management and distribution is by Toitū Te Whenua Land Information New Zealand. Data comprises: - DEM: tif or asc tiles in NZTM2000 projection, tiled into a 1:1,000 tile layout - DSM: tif or asc tiles in NZTM2000 projection, tiled into a 1:1,000 tile layout - Point cloud: las tiles in NZTM2000 projection, tiled into a 1:1,000 tile layout Pulse density specification is at a minimum of 4 pulses/square metre. Vertical Accuracy Specification is +/- 0.2m (95%) Horizontal Accuracy Specification is +/- 1.0m (95%) Vertical datum is NZVD2016. Note: imagery was also captured as part of this survey, which is published as [Queenstown Lakes 0.1m Urban Aerial Photos (2022-2023)](https://data.linz.govt.nz/layer/112781).
-
Orthophotography within the Taranaki Region captured in January 2022. Coverage encompasses Alton, Kakaramea, and Waverley Beach. Imagery was captured for Taranaki Regional Council by Aerial Surveys Ltd, Unit A1, 8 Saturn Place, Albany 0632, New Zealand. Data comprises: • 31 ortho-rectified RGB GeoTIFF images in NZTM projection, tiled into the LINZ Standard 1:500 tile layout • Tile layout in NZTM projection containing relevant information. The supplied imagery is in terms of New Zealand Transverse Mercator (NZTM) map projection. Please refer to the tile index layer for specific details, naming conventions, etc. Imagery supplied as 5cm pixel resolution (0.05m GSD), 3-band (RGB) uncompressed GeoTIFF. The final spatial accuracy is ±0.15 at 95% confidence level in clear flat areas. Index tiles for this dataset are available as layer [Taranaki 0.05m Urban Aerial Photos Index Tiles (2022)](http://data.linz.govt.nz/layer/110560)
-
Index Tiles ONLY, for actual orthophotos see layer [Timaru 0.075m Urban Aerial Photos (2022-2023)](http://data.linz.govt.nz/layer/115057) Orthophotography within the Canterbury Region captured in the flying season of 2022-2023. Coverage encompasses locations within the Timaru District including Geraldine, Orari, Winchester, Temuka, Pleasant Point, Timaru city, and Pareora. Imagery was captured for Environment Canterbury by Landpro Ltd between the 29 December 2022 and 2 March 2022. Data comprises: • 1176 ortho-rectified RGB GeoTIFF images in NZTM projection, tiled into the LINZ Standard 1:500 tile layout. • Tile layout in NZTM projection containing relevant information. Imagery supplied with a 7.5cm pixel resolution (0.075m GSD). Also available on: • [LINZ Basemaps](https://basemaps.linz.govt.nz/@-44.2825704,171.2109375,z9.73?i=timaru-2022-2023-0.1m) • [NZ Imagery - Registry of Open Data on AWS](https://registry.opendata.aws/nz-imagery/)
-
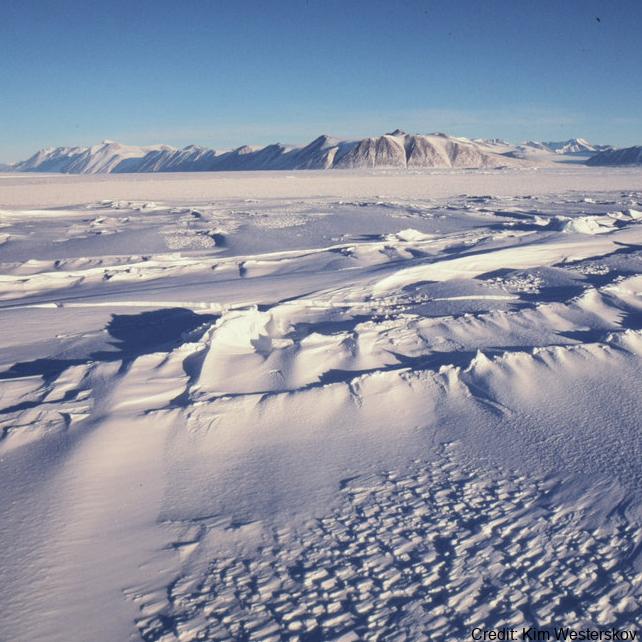
The data are approximately 800 km of airborne electromagnetic survey of coastal sea ice and sub-ice platelet layer (SIPL) thickness distributions in the western Ross Sea, Antarctica, from McMurdo Sound to Cape Adare. Data were collected between 8 and 13 November 2017, within 30 days of the maximum fast ice extent in this region. Approximately 700 km of the transect was over landfast sea ice that had been mechanically attached to the coast for at least 15 days. Most of the ice was first-year sea ice. Unsmoothed in-phase and quadrature components are presented at all locations. Data have been smoothed with an 100 point median filter, and in-phase and quadrature smoothed data are also presented at all locations. Beneath level ice it is possible to identify the thickness of an SIPL and a filter is described (Langhorne et al) to identify level ice. Level ice in-phase, quadrature and SIPL thickness, derived from these, are presented at locations of level ice. For rough ice, the in-phase component is considered the best measure of sea ice thickness. For level ice where there is the possibility of an SIPL, then the quadrature component is considered the best measure of ice thickness, along with SIPL thickness. All data are in meters.
-
Orthophotography within the Nelson Region captured in January 2022. Coverage encompasses urban areas within the Nelson City District. Imagery was captured for Nelson City Council by Aerial Surveys Ltd, Unit A1, 8 Saturn Place, Albany 0632, New Zealand. Data comprises: • 997 ortho-rectified RGB GeoTIFF images in NZTM projection, tiled into the LINZ Standard 1:1000 tile layout • Tile layout in NZTM projection containing relevant information. The supplied imagery is in terms of New Zealand Transverse Mercator (NZTM) map projection. Please refer to the tile index layer for specific details, naming conventions, etc. Imagery supplied as 7.5cm pixel resolution (0.075m GSD), 3-band (RGB) uncompressed GeoTIFF. The final spatial accuracy is ±0.15 at 95% confidence level in clear flat areas. Index tiles for this dataset are available as layer [Nelson 0.075m Urban Aerial Photos Index Tiles (2022)](http://data.linz.govt.nz/layer/109701)
-
This dataset provides a seamless cloud-free 10m resolution satellite imagery layer of the New Zealand mainland and offshore islands. The imagery was captured by the European Space Agency Sentinel-2 satellites between September 2021 - April 2022. **Technical specifications:** - 450 x ortho-rectified RGB GeoTIFF images in NZTM projection, tiled into the LINZ Standard 1:50,000 tile layout - Satellite sensors: ESA Sentinel-2A and Sentinel-2B - Acquisition dates: September 2021 - April 2022 - Spectral resolution: R, G, B - Spatial resolution: 10 meters - Radiometric resolution: 8-bits (downsampled from 12-bits) This is a visual product only. The data has been downsampled from 12-bits to 8-bits, and the original values of the images have been modified for visualisation purposes.
-
Orthophotography within the Tasman Region captured in January and March 2022. Coverage encompasses Tasman's northern rural area in the Tasman and Nelson Regions of the South Island. Imagery was captured for Tasman District Council by Aerial Surveys Ltd, Unit A1, 8 Saturn Place, Albany 0632, New Zealand. Data comprises: • 346 ortho-rectified RGB GeoTIFF images in NZTM projection, tiled into the LINZ Standard 1:5000 tile layout • Tile layout in NZTM projection containing relevant information. The supplied imagery is in terms of New Zealand Transverse Mercator (NZTM) map projection. Please refer to the tile index layer for specific details, naming conventions, etc. Imagery supplied as 30cm pixel resolution (0.30m GSD), 3-band (RGB) uncompressed GeoTIFF. The final spatial accuracy is ±0.5m at 95% confidence level in clear flat areas. Index tiles for this dataset are available as layer [Tasman 0.3m Rural Aerial Photos Index Tiles (2022)](http://data.linz.govt.nz/layer/109476)
-
This layer contains the DSM for LiDAR data in the Tasman Region over Motueka, Moutere and Waimea captured between 14 October 2022 and 7 November 2022. - The DEM is available as layer [Tasman - Tasman Bay LiDAR 1m DEM (2022)](https://data.linz.govt.nz/layer/112583). - The Index Tiles are available as layer [Tasman - Tasman Bay LiDAR Index Tiles (2022)](https://data.linz.govt.nz/layer/112582). - The LAS point cloud and vendor project reports are available from [OpenTopography](https://portal.opentopography.org/datasets?loc=New%20Zealand). LiDAR was captured for Tasman District Council by Aerial Surveys between 14 October 2022 and 7 November 2022. These datasets were generated by Aerial Surveys and their subcontractors. Data management and distribution is by Land Information New Zealand. Data comprises: - DEM: tif or asc tiles in NZTM2000 projection, tiled into a 1:1,000 tile layout - DSM: tif or asc tiles in NZTM2000 projection, tiled into a 1:1,000 tile layout - Point cloud: las tiles in NZTM2000 projection, tiled into a 1:1,000 tile layout Pulse density specification is at a minimum of 4 pulses/square metre. Vertical Accuracy Specification is +/- 0.2m (95%) Horizontal Accuracy Specification is +/- 1.0m (95%) Vertical datum is NZVD2016.