 GeoData.NZ

Type of resources
Available actions
Topics
Keywords
Contact for the resource
Provided by
Years
Update frequencies
status
-
The data are approximately 800 km of airborne electromagnetic survey of coastal sea ice and sub-ice platelet layer (SIPL) thickness distributions in the western Ross Sea, Antarctica, from McMurdo Sound to Cape Adare. Data were collected between 8 and 13 November 2017, within 30 days of the maximum fast ice extent in this region. Approximately 700 km of the transect was over landfast sea ice that had been mechanically attached to the coast for at least 15 days. Most of the ice was first-year sea ice. Unsmoothed in-phase and quadrature components are presented at all locations. Data have been smoothed with an 100 point median filter, and in-phase and quadrature smoothed data are also presented at all locations. Beneath level ice it is possible to identify the thickness of an SIPL and a filter is described (Langhorne et al) to identify level ice. Level ice in-phase, quadrature and SIPL thickness, derived from these, are presented at locations of level ice. For rough ice, the in-phase component is considered the best measure of sea ice thickness. For level ice where there is the possibility of an SIPL, then the quadrature component is considered the best measure of ice thickness, along with SIPL thickness. All data are in meters.
-

Here we present physico-chemical data collected during two research cruises conducted to and across the Ross Sea, Antarctica in the summer of 2018 (February-March) and 2019 (January-February). The dataset includes measurements of temperature, salinity, oxygen, par and transmissivity obtained with a Sea-Bird Electronics (SBE) 911plus CTD. The CTD sensor was configured with SBE 3plus, SBE 4, and SBE 43 dual sensors for the parameters above, in addition to a seapoint fluorescence sensor, and a photosynthetically active radiation (PAR) sensor (Biospherical Instruments QCP‐2300L‐HP). These data were used to provide oceanographic context to DNA metabarcoding analysis of 18S rRNA V4 region that was carried out on DNA samples collected in parallel to nutrient and chlorophyll-a samples. Fastq samples from DNA metabarcoding analysis and the associated metadata (including nutrients, Chlorophyll-a, and size-fractionated chlorophyll-a) were deposited to GenBank under project numbers PRJNA756172 (2018 cruise) and PRJNA974160 (2019 cruise). The study resulting from this analysis has been submitted to Limnology and Oceanography. RELATED PUBLICATION: Cristi, A., Law, C.S., Pinkerton, M., Lopes dos Santos, A., Safi, K. and Gutiérrez-Rodríguez, A. (2024). Environmental driving forces and phytoplankton diversity across the Ross Sea region during a summer–autumn transition. Limnol Oceanogr. https://doi.org/10.1002/lno.12526
-
The data are approximately 800 km of airborne electromagnetic survey of coastal sea ice and sub-ice platelet layer (SIPL) thickness distributions in the western Ross Sea, Antarctica, from McMurdo Sound to Cape Adare. Data were collected between 8 and 13 November 2017, within 30 days of the maximum fast ice extent in this region. Approximately 700 km of the transect was over landfast sea ice that had been mechanically attached to the coast for at least 15 days. Most of the ice was first-year sea ice. Unsmoothed in-phase and quadrature components are presented at all locations. Data have been smoothed with an 100 point median filter, and in-phase and quadrature smoothed data are also presented at all locations. Beneath level ice it is possible to identify the thickness of an SIPL and a filter is described (Langhorne et al) to identify level ice. Level ice in-phase, quadrature and SIPL thickness, derived from these, are presented at locations of level ice. For rough ice, the in-phase component is considered the best measure of sea ice thickness. For level ice where there is the possibility of an SIPL, then the quadrature component is considered the best measure of ice thickness, along with SIPL thickness. All data are in meters.
-
This metadata record represents environmental DNA sequence data and metadata barcode file. Seawater and sponge eDNA metabarcoding sampling was conducted at seven coastal locations (Cape Barne, Cape Evans, Cziko Seamount, Granite Harbor Middle, Granite Harbor South, and Turtle Rock) in the Ross Sea to assess spatial eukaryote biodiversity patterns and investigate eDNA signal differences between both substrates. Five replicate 500 mL water samples were collected at each of seven locations within 2 m of the ocean floor using a Niskin bottle. At the same time, five sponge specimens were collected by ROV at a depth range of 18–30 m from three out of the seven locations, thereby enabling sponge and near-bottom water eDNA signal comparison. Further details and laboratory procedures can be found in https://doi.org/10.1002/edn3.500 GET DATA: https://figshare.com/projects/Unveiling_the_Hidden_Diversity_of_Marine_Eukaryotes_in_the_Ross_Sea_A_Comparative_Analysis_of_Seawater_and_Sponge_eDNA_Surveys/186127
-
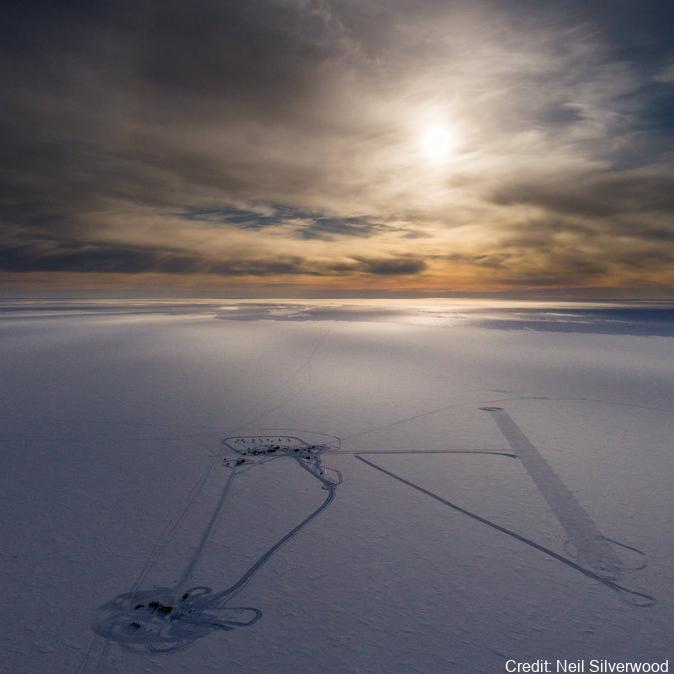
As part of the Scott Base Redevelopment Marine Monitoring Programme, the impact of Scott Base's activities on the local marine environment was assessed. Sampling took place at three sites around Hut Point Peninsula on the southern half of Ross Island during October – November 2019 to assess anthropogenic contamination. Two acoustic doppler current profilers (ADCP; Nortek Signature 500) were deployed, and set with a 2-minute sampling period in 1m vertical depth bins from the seabed to the underside of the ice. Instrument heads were kept ~0.5 m beneath the under-surface. ADCP data were downloaded, extracted from their raw formats, and averaged into 10-minute intervals. A magnetic declination of 141.09° E was applied to the measured current direction to correct the readings to reflect true north and a pressure offset was applied to standardise depths relative to ambient air pressure at the seawater surface. Information on habitats and benthic epifauna assemblage composition were collected using high resolution video across 2 25m transects at ~22m depth. Multiple overlapping passes were made across the seabed transects at ~0.5 m depth contours between ~20 – 26 m in order to create a 2D orthomosaic image of each site. Analysis of the diver-collected video was done using individual frames. The video along each transect was divided into 10 equal time segments and still frames were taken at random from the first, third, fifth, seventh and ninth segments. Eight video frames were analysed per transect (i.e., n=8 per transect and n=16 per site) by one individual to minimise observer bias. Sediment samples were collected by divers to determine contaminant concentrations and sediment characteristics (sediment particle size composition, organic matter content, organic carbon content and algal pigment content) at each site. Sponge species (Sphaerotylus antarcticus and Laternula elliptica) were collected for tissue contaminant analysis. Full description of methods is available at: https://doi.org/10.1007/s00300-023-03181-1 GET DATA: drew.lohrer@niwa.co.nz
-
This data publication contains biostratigraphic age events for the CIROS-1 drill core, updated age ranges for a suite of samples from the McMurdo erratics sample collection, age-depth tie points for CIROS-1, CRP-2/2A, DSDP 270, DSDP 274, ANDRILL 2A and ANDRILL 1B, and glycerol dialkyl glycerol tetraethers (GDGTs) abundances and indices for samples from the McMurdo erratics, CIROS-1, CRP-2/2A, DSDP 270, DSDP 274, ANDRILL 2A, and ANDRILL 1B. All sample sites are in the Ross Sea region of Antarctica. The McMurdo erratics are glacial erratics collected in the McMurdo Sound region between 1991 and 1996 (Harwood and Levy, 2000). The CIROS-1 drill core was collected from McMurdo sound in 1986 with samples spanning the upper Eocene to lower Miocene. CRP-2/2A drill core was collected in 1999 from offshore Victoria Land with samples for this study from the upper Oligocene-lower Miocene. DSDP Site 270 was recovered from the Eastern Basin of the central Ross Sea in 1973, with samples spanning the upper Oligocene-lower Miocene. DSDP Site 274 was drilled on the lower continental rise in the northwestern Ross Sea in 1973, and samples for this study have been taken from the middle Miocene sections of the drill core. The ANDRILL-2A core was recovered in 2007 from Southern McMurdo Sound, samples span the lower Miocene to middle Miocene and data was originally published in Levy et al. (2016). The ANDRILL-IB core was drilled from the McMurdo Ice Shelf in 2006, samples are compiled from the Plio-Pleistocene section of the core and were originally published in McKay et al. (2012). Biostratigraphic age events are described for CIROS-1, expanding on and updating previously published age models and biostratigraphic ranges. Ages are also revised for the McMurdo erratics by updating the ages of the biostratigraphic markers described by (Harwood and Levy (2000) to more recently published age ranges. Age models for the sample sites are developed using published age datums and the Bayesian age-depth modelling functionality in the R package Bchron (Haslett and Parnell, 2008) to ensure a consistent approach for assigning ages to core depths between datums. GDGT abundances and indices for Ross Sea sites are presented to reconstruct ocean temperatures over the Cenozoic era. Detailed methodology for the processing and analysis of samples for GDGTs is described in the methods section of supplement paper.
-
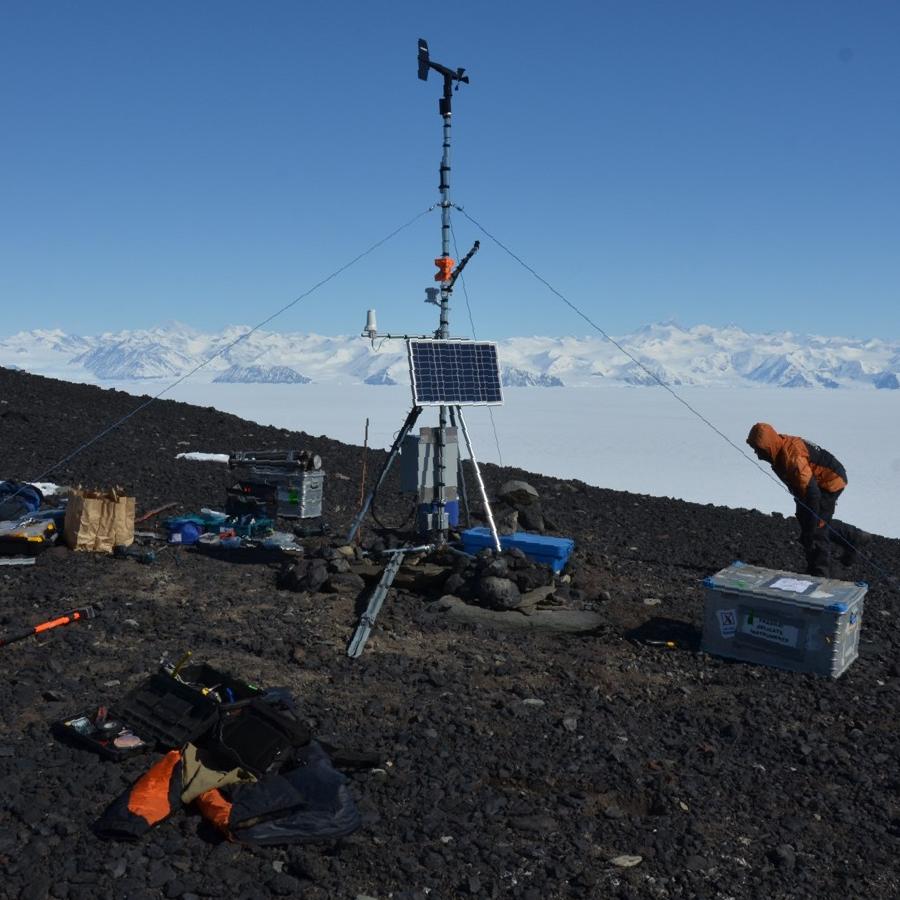
An automated weather station operates at Cape Adare (-71.30492, 170.23256). The station was established in 2014 and continues to transmit live data. Data are logged every 30 minutes. Parameters: - Air Temperature (C) - Relative Humidity (%) - Solar Radiation (W/m2) - PAR (uE) - Wind Speed (m/s) - Wind Gust (m/s) - Wind Direction (true bearing degrees) GET DATA: adminteam@antarcticanz.govt.nz
-
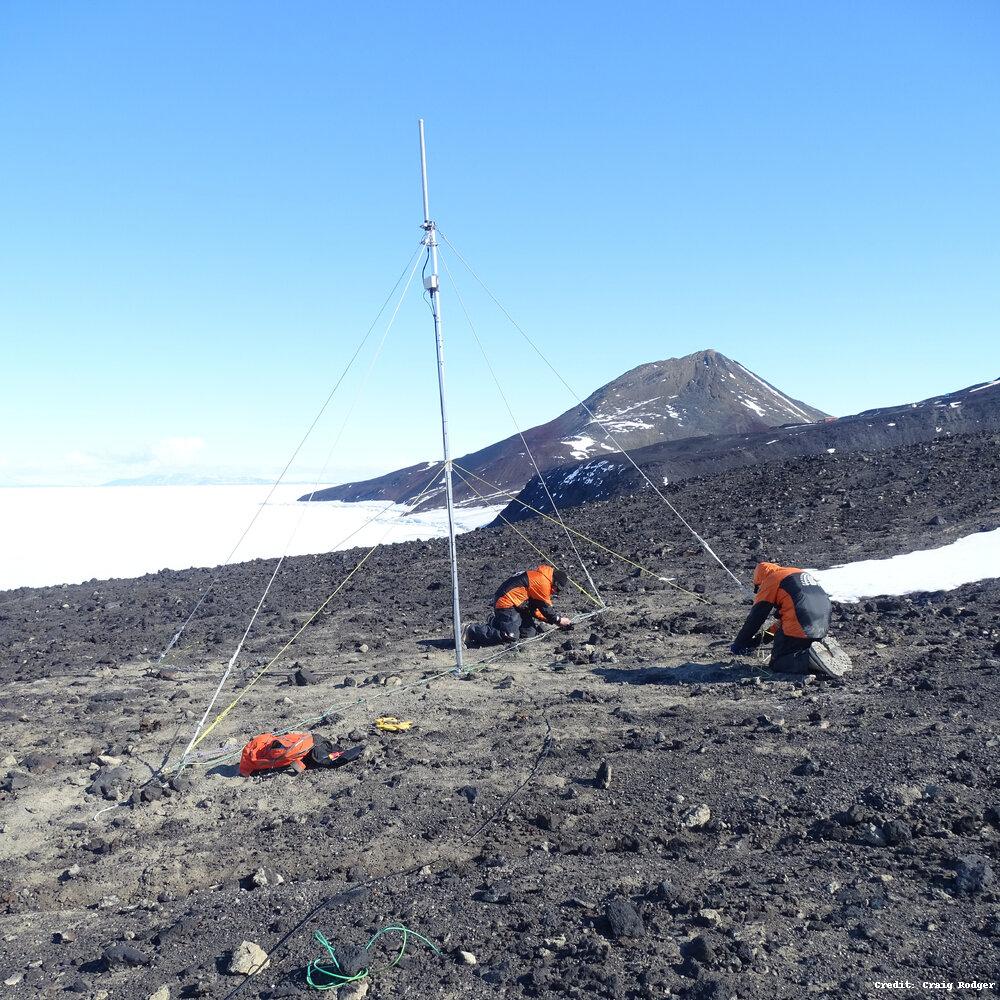
The AARDDVARK/WWLLN Very Low Frequency (VLF) Radio Sensor was installed at Arrival Heights from 10-15 December 2008 by Dr Craig J. Rodger and Dr. James Brundell as part of Antarctica New Zealand Event K069a. The sensor measures the magnetic field in the Very Low Frequency radio range (~500 Hz-50 kHz), and passes it to a PC which processes the data for the experiments. The primary experiment is the AARDDVARK observations. The secondary experiment, WWLLN, uses exactly the same VLF feed but processes it to detect the radio-wave pulses from lightning. WWLLN observations are sent to a central processing computer to determine the time and location of lightning pulses all over the globe. The World Wide Lightning Location Network (WWLLN) is an experimental Very Low Frequency (VLF) network of sensors being developed through collaborations with research institutions across the globe. The network exploits the considerable electromagnetic power radiated by lightning as "sferics" present in the VLF band. By combining radio-pulse observations from at least 5 stations, the WWLLN central processing computers can determine the location of the original lightning discharge. As the radio-pulse observations are immediately sent back across the internet to the central processing computers locations are generated within ~10 s of the discharge, and thus near real time. There are currently about 70 active VLF receiving stations operating in the VLF World-Wide Lightning Location Network, including the "Scott Base" measurements made at Arrival Heights or near the Hatherton Lab (depending on noise levels). WWLLN observations are continuously transmitted to one of the WWLLN primary servers, in this case flash.ess.washington.edu at the University of Washington, Seattle, USA. Two near-orthogonal magnetic field loops measuring VLF electromagnetic waves. The centre of the antenna is at 77° 49.790' S, 166° 39.438' E, based on a GPS measurement with 1 m accuracy. Logging is undertaken with standard WWLLN software, with GPS timing. GET DATA: https://wwlln.net/
-
This metadata record represents the data for generated by mining single-cell genomic, transcriptomic, and metagenomic data to uncover the viral diversity, biogeography, activity, and their role as metabolic facilitators of microbes beneath the Ross Ice Shelf. Hot drilling and seawater sampling was conducted from the sub-shelf water column in the central region of the RIS (Latitude −80.6577 N, Longitude 174.4626 W). The sampling site was located ≈300 km from the shelf front. A borehole (30 cm diameter) conducted by hot water drilling was used for direct sampling of seawater from three depths (400 m, 550 m, and 700 m from the top of the shelf, which correspond to 30 m, 180 m, and 330 m from the bottom of the ice shelf, respectively). Seawater samples were processed accordingly for single cell genomics, metagenomics, and transcriptomics as described5, and the resulting assembled and co-assembled contigs (min. length 1 kb) from single-amplified genomes, bins and transcriptomics were mined for detecting viral contigs. Further details are provided at https://doi.org/10.1038/s41467-023-44028-x GET DATA: https://doi.org/10.6084/m9.figshare.24581331
-
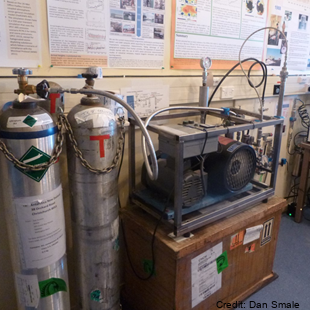
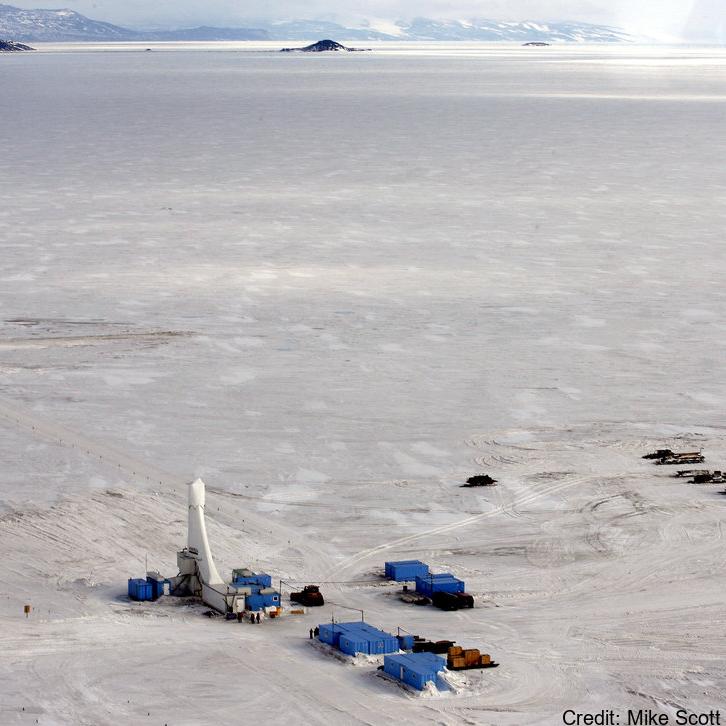
Gas samples (CO2, CH4, CO, N2O, 13CO2, 14CH4, 13CO, C18O, 14CO) are collected from an inlet atop of a mast 5 metres above ground level in North sector wind conditions. Flasks and cylinders are analysed back at NIWA Greta point Gaslab. The sampling was established in November 1989. Samples are only taken when wind is from the Northerly sector and above 5kts. High pressure cylinders: ~1600psi in 30 litre cylinders and low-pressure flask samples taken (~5 litres, 25 psi in 2 litre flask). Air samples in the Cylinders & Flasks shipped to New Zealand regularly. Analysis performed at NIWA's GASLAB located at Greta Point Wellington. Analysis by Gas chromatography (GC) and isotope ratio mass spectrometry (IRMS). A semi-automated flask sampling system was installed in February 2017, allowing extra flask samples with minimal operator intervention. GET DATA: Contact Gordon Brailsford (g.brailsford@niwa.co.nz)